


What's the Difference Between Relative Strength and Trend Following?
by Corey Hoffstein, Newfound Research
After publishing our Two Centuries of Momentum article last week, we received a number of requests for our thoughts on the recent underperformance of multi-asset, relative strength portfolios.
Now, we tend to fall more on the trend following side of momentum. So we wanted to spend some time talking about the difference between relative strength and trend following.
Hopefully, in doing so, we can also shed some light on expected performance differences between the strategies as well as against a benchmark.
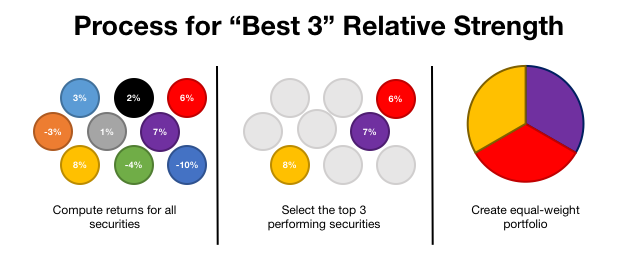
So what is a multi-asset, relative strength strategy? Traditionally, a relative strength strategy works by sorting securities based on some trailing return metric and tilting the portfolio portfolio towards those that have recently out-performed.
For example, a “Best 3” strategy might sort asset classes by trailing realized returns and build an equal-weight portfolio out of the three asset classes that the best returns.
Trend-following, on the other hand, does not make relative comparisons. Instead, each asset class is evaluated as to whether it had a positive or negative performance over the trailing period.
So a simple trend following strategy may be to go long those asset classes that have had positive trailing returns and hold cash for those that had negative returns.

To explore how these two strategies differ, we created an equal-weight benchmark portfolio, a Best 3 relative strength portfolio, a and long-only trend following portfolio.
In this study we employed the following 9 asset classes: Commodities (DBC), Emerging Markets (EEM), Foreign Developed (EFA), Gold (GLD), U.S. Large-Cap (IWB), U.S. Small-Cap (IWM), U.S. REITs (RWR), Long-Term Treasuries (TLT), 3-Month T-Bills (BIL).
To evaluate performance, we utilized 12-month trailing realized returns on a 1-month lag. For example, to create the portfolio for August 2015, we evaluated returns from June 30, 2014 to June 30, 2015. Common in momentum research, we employ this one-month lag to account for short-term mean-reversion.
We rebalanced the portfolios on a monthly basis.
The performance results are entirely hypothetical. They are net of ETF expense ratios but gross of any manager fees. We also do not estimate trading costs or market impact in this analysis.
Without further adieu … the results.


What we see is that the relative strength portfolio was able to nearly double annualized returns, keep volatility about the same, and cut max drawdown by about 1/3rd when compared to the benchmark equal weight portfolio.
Trend following was able to nearly match returns, cut volatility in half, and cut drawdown by 2/3rds.
But these broad statistics only tell part of the story. They tell us what the end results were, but not what was the ride like in each strategy.
A better way to look under the hood is with relative performance graphs.
We can see this by looking at relative performance charts. These charts divide one strategy’s equity curve by another, giving insight into relative performance of the two strategies.
First, the relative strength strategy versus the equal-weight portfolio.

A few things to note in this graph. First, at the end of the period, a dollar invested in the relative strength strategy was worth nearly 1.5x a dollar invested in the benchmark.
Second: the ride to get there was certainly not smooth.
From 5/2007 to 3/2009, the relative strength strategy trounced the equal weight portfolio. However, there was a large momentum crash coming out of the 2009 crises and the Best 3 strategy gave up much of this performance in just a few months.
Then, for the next few years, relative strength more or less took us sideways, until Q3 2011, when it went on a losing streak. It wasn’t until late 2012 / early 2013 that relative strength really began to shine again.
The point here is that while we may believe in relative strength as a strategy that can add value over market cycles, we have to be prepared for it to significantly underperform over shorter horizons. This is par for the course with such a strategy.
Next, the trend following strategy versus the equal weight benchmark.

We see a similar momentum benefit in the 2008 crisis and the subsequent momentum crash. Post crash, however, there has been little out-, or under-, performance.
The strategy can really only benefit when there are prolonged downtrends. And besides the recent commodity and gold breakdown of the last 12 months, there have been few opportunities to add value with such a strategy.
When everything is going up, there is little that trend following can do to outperform the benchmark. Relative strength, on the other hand, can rotate into those asset classes going up faster in an effort to create excess returns.
On the other hand, the more constrained nature of the trend following portfolio also means that there have been fewer opportunities to underperform from bad trades.
At Newfound, we believe that momentum is a robust way of investing, in both its relative strength and trend following forms. That said, the experience of investing in each of these strategies will be different.
Relative strength provides the opportunity to outperform the benchmark on an absolute basis in all market environments. This means, in our opinion, it also takes on more active risk.
For the opportunity to outperform on an absolute basis, it also bears the risk of significantly underperform the benchmark for prolonged periods of time.
Trend following is constrained to outperforming only when markets are declining. Therefore, in strong bull markets the best it can do is keep up. However, by being more constrained, it arguably takes less active risk and is less likely to get whipsawed.
We can see this in the post-2009 relative performance numbers where trend following more or less stayed at parity with the benchmark.
So for investors looking to outperform the benchmark on an absolute basis, relative strength may be the way to go. However, such an approach will likely lead to periods of significant underperformance.
For investors merely looking to avoid significant losses and just keep up during market growth – a “protect and participate” mandate – we advocate a trend following approach. While the best such a strategy can do is match benchmark returns in bull markets, it also helps take the risk of significantly underperforming off the table.
Of course, no strategy is guaranteed to deliver on its objective. But for those looking to take a momentum approach, understanding the difference between relative strength and trend following strategies is critical for setting appropriate performance expectations.
Copyright © Newfound Research