


The chart below shows several issues investors struggle with all the time. It’s difficult to pick the best performing investment year after year, yet for many investors it’s an annual event. They look for an encore, picking the best asset class last year with the hope of a repeat performance. Yet, betting on last year’s winner rarely works out.
Assets at the top of the chart one year could be at the bottom the next, and vice versa. Much of this is due to reversion to the mean. But over the long-term, those big swings even out. The chart shows annual returns for eight asset classes against a diversified portfolio. Diversification works to smooth out those big swings in the short-term. While you’ll never get the biggest gains of any year, you avoid the huge losses.
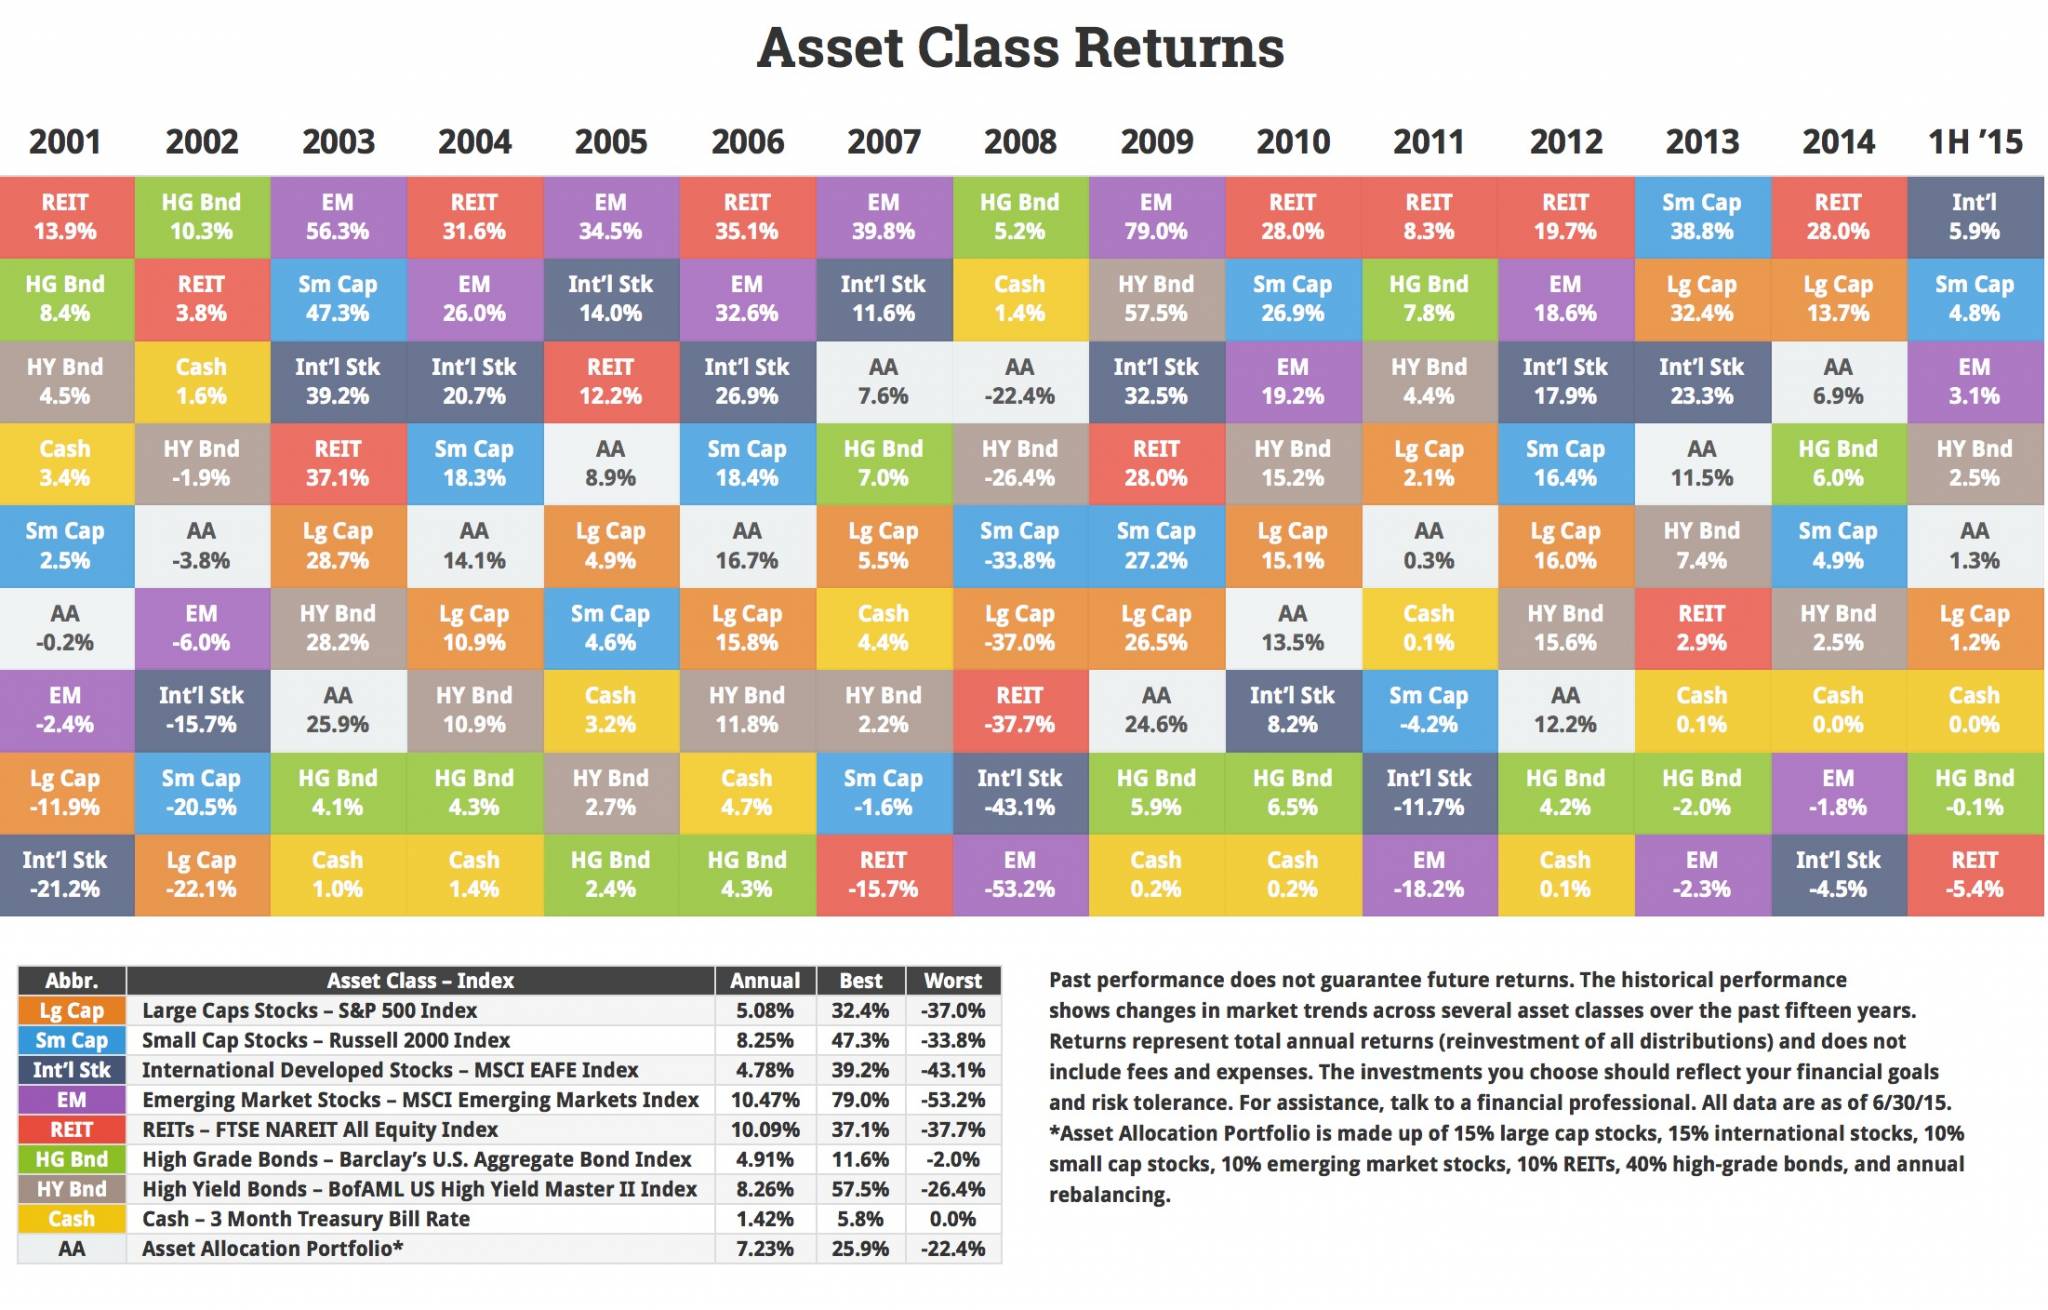
The table below ranks the best to worst investment returns by asset class over the past 15 years. Hover over the table to highlight the asset class returns. Get your copy.
Click to enlarge
 Source: NovelInvestor.com
Past performance does not guarantee future returns. The historical performance shows changes in market trends across several asset classes over the past fifteen years. Returns represent total annual returns (reinvestment of all distributions) and does not include fees and expenses. The investments you choose should reflect your financial goals and risk tolerance. For assistance, talk to a financial professional. All data are as of 6/30/15.
*Asset Allocation Portfolio is made up of 15% large cap stocks, 15% international stocks, 10% small cap stocks, 10% emerging market stocks, 10% REITs, 40% high-grade bonds, and annual rebalancing.