by Burt White, Chief Investment Officer, LPL Financial
This week’s commentary features content from LPL Research’s Midyear Outlook 2015: Some Assembly Required.
Expect the bull market to continue through 2015. In the stock market, 2015 has felt like déjà vu. In 2014, the year began with a tough first quarter and finished strong. After a weak start to the year, we believe that corporate America will provide a much needed boost for the second half and 2015 may also finish strong — providing the seventh year of positive returns, in the 5 – 9% range we forecast.
STOCKS ON TRACK TO PRODUCE DESIRABLE YEAR-END RETURN
We remain confident in our 5 – 9% total return forecast for the S&P 500 for 2015, although reaching that target will require a power boost from corporate America. Our forecast is in-line with the long-term average range of a 7 – 9% annual gain for stocks, based on the S&P 500 Index, since WWII. Our forecast is based on expected mid-single-digit earnings per share (EPS) growth for S&P 500 companies, supported by improved global economic growth, stable profit margins, and share buybacks in 2015, with limited help from valuation expansion.
The S&P 500 Index is on track to meet that forecast by year-end, having returned 3.5% year to date through the end of May 2015 (and 3.5% year to date through June 19, 2015). However, headwinds that emerged early in 2015 mean getting there will require fresh batteries to fuel a second half charge.
INSTRUCTION MANUAL FOR EARNINGS REBOUND
We expect the power boost for stocks to come from an earnings rebound, which likely requires some improvement in U.S. economic growth after the unexpected soft patch in early 2015. S&P 500 earnings hardly showed much spark during the first quarter of 2015, growing just 2% versus the prior year period. Earnings need more support to overcome the two biggest sources of resistance: lower oil prices and the strong dollar, which have only recently begun to ease.
The instruction manual for how to assemble our mid-single-digit earnings growth target includes several steps, none of which are easy:
Improve economic growth. We expect better growth over the balance of 2015 following a subdued first quarter.
Stabilize (or increase) oil prices. Oil price stability would help mitigate the energy sector’s drag on S&P 500 earnings, estimated at about 6% in the first quarter of 2015.
Pause the U.S. dollar rally. The strong U.S. dollar caused an estimated mid-single-digit percent earnings reduction in the first quarter of 2015 due to the negative impact on revenue earned overseas in foreign currencies.
Maintain or expand profit margins. We believe corporate America may be able to maintain lofty profit margins, supported by stellar efficiency, only modest upward wage pressures, low borrowing costs, and still low commodity prices.
Continue heavy share buyback activity. Share buybacks contributed 3% to S&P 500 earnings in 2014, a trend that we expect to continue due to strong corporate balance sheets.
Our favorite leading indicator for earnings growth is the Institute for Supply Management’s (ISM) Purchasing Managers’ Index (PMI). A sharp downshift in oil sector capital expenditures and a strong dollar pulled the index from an August 2014 peak of 58.1 to its May 2015 value of 52.8. However, we believe the impact has already been factored into forward earnings expectations.
DELICATE MATERIALS INCLUDED IN FED PACKAGE, BUT RISK IS MANAGEABLE
Further gains for stocks during the second half of the year will require investors to overcome their interest rate anxiety. We expect the Fed to hike interest rates in late 2015 for the first time since June 2006.
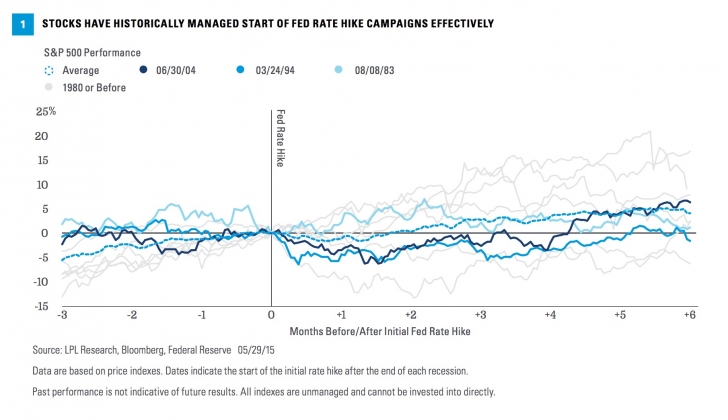
Some volatility around the first Fed rate hike in an economic cycle is normal. Figure 1 shows the performance of the S&P 500 around the 9 initial rate hikes after the end of each recession since the end of WWII, highlighting the last three dates (1983, 1994, and 2004) and the average. The S&P 500 moved higher 5 out of 9 times 3 months after an initial rate hike, but performance improved over time. The S&P 500 increased 7 out of 9 times over the following 6 months, with an average gain of 4.2%. We expect the pace of Fed rate hikes to be gradual; therefore, we do not see the potential start of interest rate hikes as a big risk to the stock market over the balance of the year.
UPGRADING TO ENHANCED MODEL: THIS BULL MARKET HAS LONGER LIFE
We believe the now six-year-old bull market has a good chance of reaching its seventh birthday (in March 2016), which would mark the third-longest bull market since the end of WWII, trailing only the post-war bull market (June 13, 1949 to August 2, 1956) and the 1990s bull market (October 11, 1990 to March 24, 2000). While a lot of pieces must come together for the S&P 500 to reach our return target for the year, the most important piece for the bull market to continue is the absence of a recession.
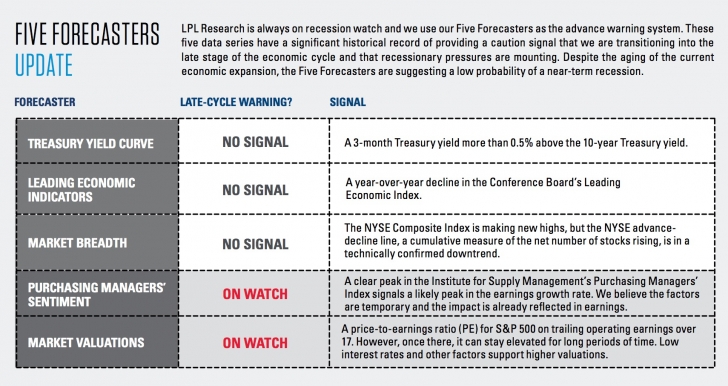
LPL Research is always on recession watch and we use our Five Forecasters as the advance warning system. The Five Forecasters are our favorite leading indicators for evidence of an economic downturn that could cause the bull market to come apart. These five data series, of economic, financial market, and technical factors (shown in Five Forecasters Graphic below), have a significant historical record of providing a warning signal that the economy is transitioning into the late stage of the economic cycle and recessionary pressures may be mounting. Despite the aging of the current economic expansion, the Five Forecasters are suggesting a low probability of a near-term recession. Thus, we expect the continuation of the bull market into 2016.
Stock market pullbacks (5 – 10% decline), or the occasional correction (10 – 20% decline), typically become more likely during the latter half of the business cycle. Pullbacks and corrections have been rare in recent years. Nearly four years have passed since the last correction (October 3, 2011), and only three pullbacks have occurred since September 2012. Over the past 12 months, bouts of brief sell-offs have become more common, in-line with the historical trend to see more volatility over the second half of the business cycle; but potentially higher volatility in the second half should not prevent stocks from achieving our return target.
DON’T ANCHOR TO VALUATIONS
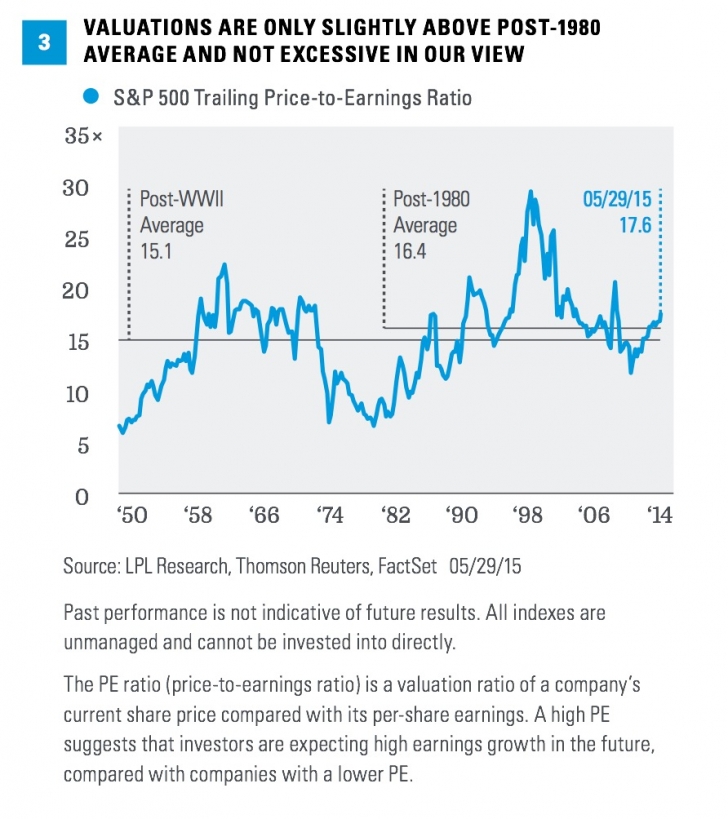
Despite a good fundamental foundation, stock valuations are not providing much support. The trailing price-to-earnings ratio (PE) of the S&P 500 Index stands at 17.6 (as of the end of May 2015), which is above the long-term average of 15.1 dating back to WWII but is reasonable when compared with the post-1980 average of 16.4 [Figure 3, page 5].
Several factors suggest stocks can build on year-to-date gains even at current valuation levels:
Low inflation increases the value of future earnings and helps keep interest rates low, which increases the value of future earnings and also the relative attractiveness of stocks versus bonds.
Temporary factors, such as lower oil prices and U.S. dollar strength, are depressing earnings, making stocks temporarily appear more expensive.
Earnings estimates for the coming year may be too low due to energy cost savings and the severity of earnings estimate cuts in the energy sector.
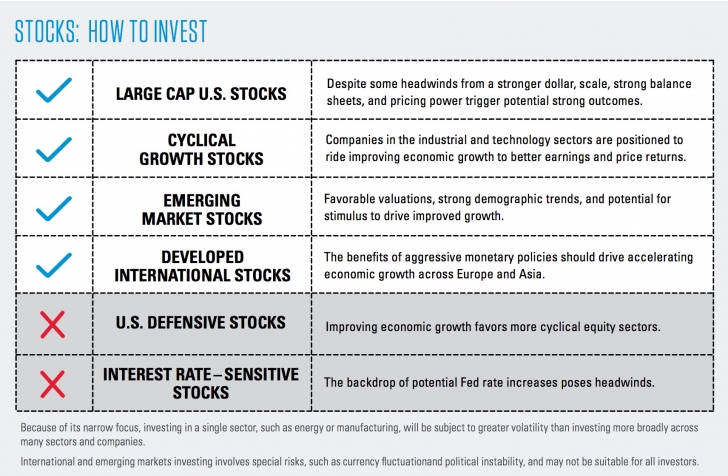
HOW TO INVEST
The following graphic depicts our recommendations for how to invest equity portfolios. We continue to recommend investors emphasize cyclical growth stocks in the U.S. and limit exposure to defensive and interest rate sensitive sectors. We have, however, become increasingly positive on developed foreign equities and continue to like emerging markets.
Because of its narrow focus, investing in a single sector, such as energy or manufacturing, will be subject to greater volatility than investing more broadly across many sectors and companies.
CONCLUSION: CHARGING AHEAD
Stocks are likely to remain the primary driver of diversified portfolio returns over the second half of 2015. Returns are dependent on an earnings recharge to reach full potential. With additional support from corporate America, we expect stocks to add to first half gains over the remainder of 2015 and the six-year-old bull market to power toward its seventh birthday in March 2016. n
There is no guarantee that a diversified portfolio will enhance overall returns or outperform a nondiversified portfolio. Diversification does not protect against market risk.
Read/Download the complete report below:
Weekly Market Commentary 06222015(1)
IMPORTANT DISCLOSURES
The opinions voiced in this material are for general information only and are not intended to provide specific advice or recommendations for any individual. To determine which investment(s) may be appropriate for you, consult your financial advisor prior to investing. All performance referenced is historical and is no guarantee of future results.
The economic forecasts set forth in the presentation may not develop as predicted and there can be no guarantee that strategies promoted will be successful.
Investing in stock includes numerous specific risks including: the fluctuation of dividend, loss of principal, and potential liquidity of the investment in a falling market.
All investing involves risk including loss of principal.
INDEX DESCRIPTIONS
The Standard & Poor’s 500 Index is a capitalization-weighted index of 500 stocks designed to measure performance of the broad domestic economy through changes in the aggregate market value of 500 stocks representing all major industries.
The Institute for Supply Management (ISM) Index is based on surveys of more than 300 manufacturing firms by the Institute of Supply Management. The ISM Manufacturing Index monitors employment, production inventories, new orders, and supplier deliveries. A composite diffusion index is created that monitors conditions in national manufacturing based on the data from these surveys.
The S&P 500 Index is a capitalization-weighted index of 500 stocks designed to measure performance of the broad domestic economy through changes in the aggregate market value of 500 stocks representing all major industries.
Copyright © LPL Financial


