History of Bull Market Length
by Tiho Brkan, The Short Side of Long
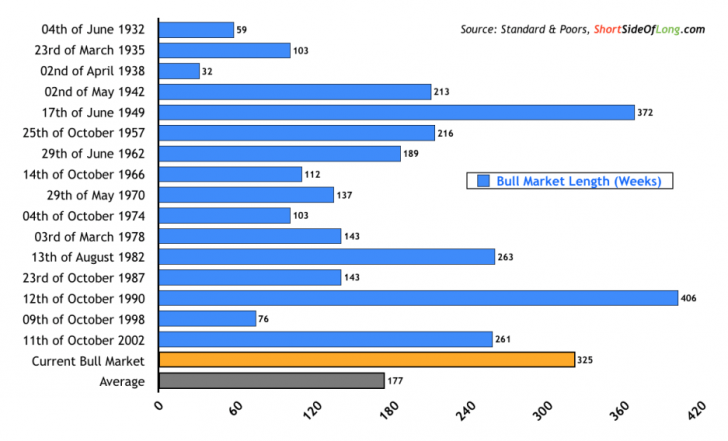
Chart Of The Day: This is the 3rd longest bull market over last 80 years!
Source: Short Side Of Long
Today's chart of the day once again focuses on the history of previous US equity bull market lengths, comparing it to the current one which started on 09th of March 2009. As the chart above clearly shows, the current bull market at 325 weeks (or over 6 years) is now third oldest in the last eight decades. Only the 1950s and 1990s bull markets lasted longer. History shows that an average bull market lasts about 177 weeks or three and half years. We are slowly approaching double that average and obviously the risks are increasing that the end is near...
Copyright © The Short Side of Long


