by Ben Carlson, A Wealth of Common Sense
There are some compelling cases being made right now in both academic and investor circles that future U.S. stock market returns will be muted from current levels. Some are going a step further and claiming that real returns over the next decade or so will be zero or even negative.
One of the most heavily cited examples given for these forecasts is Robert Shiller’s Cyclically-Adjusted Price to Earnings (CAPE) ratio. Professor Shiller has a treasure trove of historical information on the CAPE and other well-known market metrics going back to the late-1800s on his website. The fact that the data covers such a long time frame offers investors a large sample size to test their return-forecasting models. But I still think it’s a stretch to think we can accurately forecast market returns using this series.
The CAPE at the start of 2015 came in at 26.5 times the trailing ten year’s worth of inflation-adjusted earnings data. Looking back at the long history of the CAPE ratio, this level hasn’t been breached too often and it’s far above the average of 16.6x going back to the start of this data set. I looked back on Shiller’s data and found every calendar year that began with a CAPE of 26.5x or higher along with the subsequent annual five and ten year return numbers on the S&P 500:
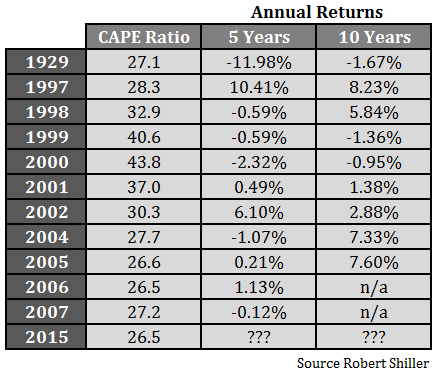
As with most historical market data, you can always pick and choose certain scenarios to bolster or disprove a current forecast. Shiller’s data goes all the way back to 1871. So out of nearly 150 years, there have only been twelve times in which the market started out the year with a CAPE ratio of 26.5x or higher. There are two ways you could look at this data:
- Wow, the majority of the market’s biggest historical crashes and low returning periods over the past 100 years have coincided with an elevated CAPE ratio.
- Wow, in over nearly 150 year’s worth of data there is an extremely limited sample size in which to draw conclusions from the information on elevated CAPE ratios.
Anyone with a healthy dose of common sense would probably choose to look at the data in both of these ways. It’s true that above average CAPE ratios have led to lower than average stock market returns in the past. Ten years out the annual return average is just 3.3%, while the average five year gain was just 0.2% annually. But it’s also true that this limited sample size has seen a wide range of returns between the best and worst case scenarios.
It’s also amazing how clustered the above average CAPE periods have been over the past twenty years or so. Since the beginning of 1997, the first time since 1929 that a year started out with a CAPE above 27, the S&P 500 is up 386% or almost 9% per year. (This date also happens to closely coincide with Alan Greenspan’s famous Irrational Exuberance speech in December of 1996.) Over that time the average CAPE ratio is 27.1. Granted there were periods in-between that saw terrible losses in that time and the CAPE ratio fluctuated, but that’s how things work in the stock market.
My point in this exercise is to show how little pundits and forecasters have to go on, even if they’re using one of the longest market data sets at our disposal. Sure, you could use this data to set reasonable expectations and maybe even offer a range of possible returns. Even then, there’s a good chance the future could see outliers either higher or lower than the historical precedent. I would take any future return predictions from these levels with a huge grain of salt, especially if the party making the forecast isn’t willing to consider a wide range of potential outcomes.
Anyone claiming to have anything approaching certainty in their return forecast for the stock market is nuts.
Further Reading:
The CAPE Ratio and a Range of Historical Outcomes
Torturing Historical Market Data
Subscribe to receive email updates and my quarterly newsletter by clicking here.
Follow me on Twitter: @awealthofcs
Copyright © A Wealth of Common Sense