by Dana Lyons, J. Lyons Fund Management Inc.
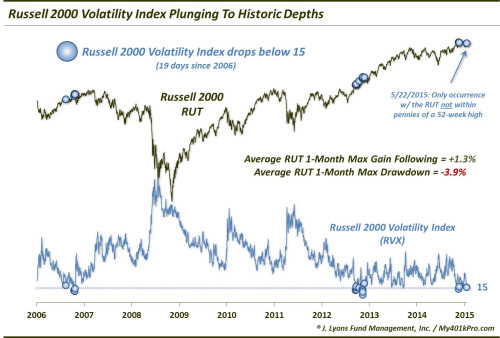
If it feels like the stock market hasn’t moved in a few days, you’re not imagining things. With the long weekend approaching, it seems as though Wall Streeters (or their robots) packed up and departed for the mythological “Hamptons” days ago. As it pertains to the small caps, as represented by the Russell 2000, it isn’t merely pre-holiday low volatility, however. It is historically low, period. As measured by the Russell 2000 Volatility Index (RVX), volatility expectations for the small cap index have only been this low a couple of times since its inception in 2006.

As the chart reveals, there have been a total of 19 days since 2006 that the RVX has traded below 15. Most of them occurred within the following windows:
December 2006 & February 2007 (6 days): The Russell 2000 hit a short-term peak almost immediately, dropping 8% in about a week. It would recover and rally for 4 more months, making marginal new highs before forming its cyclical top.
January & March 2013 (10 days): The Russell 2000 was early into its 15-month, nearly straight-up rally. However, the index did struggle to gain much traction in the days and weeks following most of these readings.
March 2015 (2 days): The Russell 2000 hit a short-term peak immediately, dropping 3% in a few days before returning to its high.
It is difficult to make much out of this development with so few precedents. However, in the short-term, low readings in the RVX like this have not presented favorable times to be long. Even those times when the Russell 2000 did not immediately pull back (e.g., 2013), it still struggled to gain much ground in the near-term. On average following these readings, the maximum gain over the subsequent month has been +1.3% while the average drawdown has been -3.9%. So the short-term risk:reward setup is not attractive.
Longer-term, the limited precedents (not to mention, limited history) does not allow for any reliable conclusions. The Russell 2000 was able to rally for awhile following the 2013 occurrences. However, it ran into a cyclical top not long after the 2007 examples.
We will say – and it’s no revelation – that low volatility is a hallmark of market tops. That said, such low volatility can persist for some time. Witness the historic lows in the S&P 500 Volatility Index, VIX, in the mid-1990′s. The market went on to rally for several more years following that example. However, the norm is for low volatility to be more representative of tops.
Of course, volatility expectations can always go even lower. Looking historically, though, the rubber band is essentially as stretched to the down side as it has ever been. Therefore, if the RVX continues lower, it would be pushing a new lower bound on its all-time chart.
Lastly, one interesting aspect of today’s reading of the RVX is that it occurred despite the fact that the Russell 2000 is not at a 52-week high. Every other sub-15 occurrence in the RVX has come with the Russell 2000 at a high, or within 0.3% of one. What the significance of that is, we’re not sure. It may just have something to do with the impending long weekend.
What’s the ultimate takeaway? Considering the broad market is over 2 years into a rally without anything much in the way of a correction, not to mention 6 years into a cyclical bull market, the historically low volatility is certainly not a “buy signal”. As we said, the low volatility can persist for awhile. However, for stock bulls, that is a tougher road to hoe than it would be with volatility expectations higher. Therefore, at a minumum, the historically low volatility likely means a “hold” for stocks rather than a buy.
Have a great Memorial Day weekend. Please remember those who served and paid the ultimate sacrifice for our country.
The photo (source: U.S. Navy) is of the crew of the U.S. Naval Submarine, USS Thresher (SSN-593). The Thresher suffered an accident in 1963 during exercises that resulted in the loss of the boat and its entire crew. The 129 casualties represent the worst U.S. Naval submarine tragedy in history.
_____________
More from Dana Lyons, JLFMI and My401kPro.
The commentary included in this blog is provided for informational purposes only. It does not constitute a recommendation to invest in any specific investment product or service. Proper due diligence should be performed before investing in any investment vehicle. There is a risk of loss involved in all investments.
Copyright © J. Lyons Fund Management Inc.


