China: New Year, New Opportunity?
KEY TAKEAWAYS
- Regardless of whether China hits its 7% GDP target for Q1, its stock market has already been positive so far this year.
- Despite strong recent performance, Chinese stocks may see further gains.
- We maintain our positive view of broad EM, with a preference for Asia.
by Burt White, Chief Investment Officer, LPL Financial
China will release its first quarter 2015 gross domestic product (GDP) report this week on April 14, 2015, with the market expecting a 7% year-over-year increase. Regardless of whether China hits that target, its stock market has already been positive so far this year. In this year of the goat in 2015, global investors have not been sheepish about buying Chinese stocks, powering the Shanghai Composite 25% higher so far in 2015 amid prospects for more monetary stimulus and policy reforms. These gains came on top of last year’s solid performance, when the Shanghai Composite surged 49%. The recently launched trading link between mainland Chinese markets and Hong Kong and low oil prices have also been factors, all of which beg the question: Will this strength continue?
PICTURE IMPROVING FOR BROAD EM
In our November 18, 2014, Weekly Market Commentary, “Emerging Markets Opportunity Still Emerging,” we highlighted that emerging markets (EM) fundamentals were poised to improve with help from policy actions. Valuations were attractive and there was strong mean reversion potential; both factors are still in place. At the time we were waiting for several developments before becoming even more positive on EM, including better relative strength, improving earnings, and stable oil prices.
Based on these factors, EM looks better to us than it did last fall. Relative strength has improved and EM is trading at a 25% discount to the S&P 500’s forward price-to-earnings ratio (PE). But earnings have shown little improvement and oil remains historically oversupplied and volatile. We feel good about our positive EM view, but are hesitant to turn much more positive at this time.
The PE ratio (price-to-earnings ratio) is a measure of the price paid for a share relative to the annual net income or profit earned by the firm per share. It is a financial ratio used for valuation: a higher PE ratio means that investors are paying more for each unit of net income, so the stock is more expensive compared to one with lower PE ratio.
Price-to-book ratio is the stock’s capitalization divided by its book value.
CHINA OFFERS GOOD PROFITABILITY FOR THE PRICE
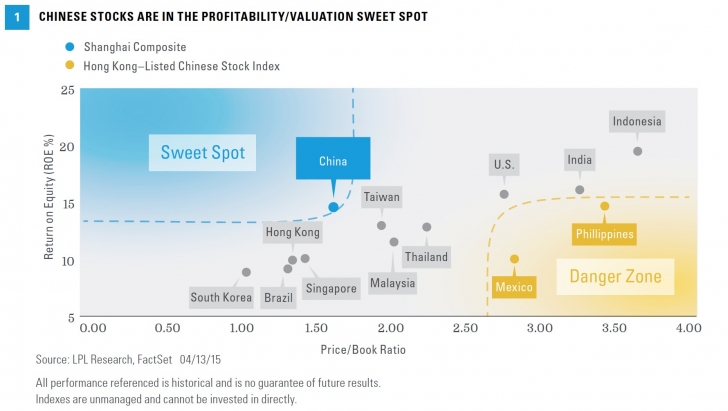
We also wrote in November 2014 that we favored emerging Asia over Latin America due to the better combination of economic and earnings growth, current account surpluses, and the benefits of lower oil prices. Within Asia, we believe China offers a favorable combination of profitability and low valuations. Figure 1 plots the return on equity, or ROE (a measure of profitability available for shareholders calculated by dividing profits — net income — by shareholders’ equity, or assets minus liabilities) against valuation (price-to-book value) for major EM markets in Asia and Latin America.
Despite strong gains recently, the Chinese stock market still looks attractively valued on a PE basis, at a 30% discount to the S&P 500 on a forward PE basis and an even larger discount on trailing PE. Although we find that discount attractive, some of it is warranted given the volatility of the Chinese stock market and the exposure to state owned enterprises that are required to consider other factors such as social welfare and the Chinese government’s strategic goals, along with shareholder returns.
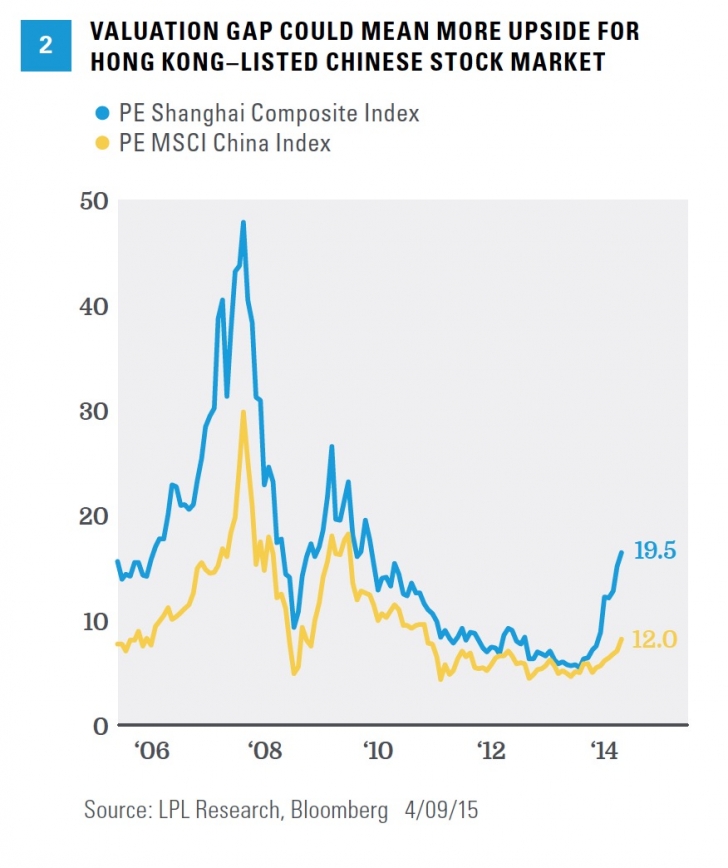
Another way to look at valuations in China is to analyze the gap between the PE on Chinese stocks trading in Hong Kong (represented by the MSCI China Index) to those trading in mainland China (the Shanghai Composite). Figure 2 shows that gap has widened, with mainland China trading at a PE of over 19, while Chinese stocks in Hong Kong are trading at a PE of only about 12. We see value in the Hong Kong–listed Chinese market, with the potential for this gap to close.
The picture is mixed in China with respect to economic and earnings growth. Economic growth seems to have stabilized, presumably at the government’s 7% growth target, but actual growth may be in the 5 – 6% range (for more details on China’s growth outlook see this week’s Weekly Economic Commentary, “Gauging Global Growth: An Update for 2015 & 2016”). First quarter 2015 earnings for the MSCI China Index are expected to fall 11.5% year over year, weighed down by energy (as in the U.S.). For the full year, China is expected to produce a 5% increase in earnings in 2015, based on FactSet estimates, although potential upside could come from additional policy actions by the Chinese government that could help boost economic growth.
IMPACT OF HONG KONG TRADING LINK
Chinese stocks trading in the mainland China are highly volatile due to momentum-driven market participants and the limited number of investment options available to Chinese citizens. For years, Chinese investors have only been able to purchase stocks on local exchanges, the so-called “A-share” market, and sought to diversify their portfolios by investing in stocks listed offshore. In contrast, Hong Kong–based investors have struggled to find companies that directly benefit from increased consumer spending by China’s growing middle class. Shares of these companies typically list only on this A-share market, not in Hong Kong.
Recently, the Chinese government created the Mutual Market Access (MMA) program, allowing trading links between the mainland China and the Hong Kong stock markets. This program allows both groups of investors to get what they want. The MMA may also narrow the historically wide valuation gap between the A-share and Hong Kong markets for shares in the same company. Not only is this important for these markets in the short term, it is widely believed this is a first step toward moving the Chinese currency (the yuan) to more widespread acceptance.
TECHNICAL BREAKOUT?
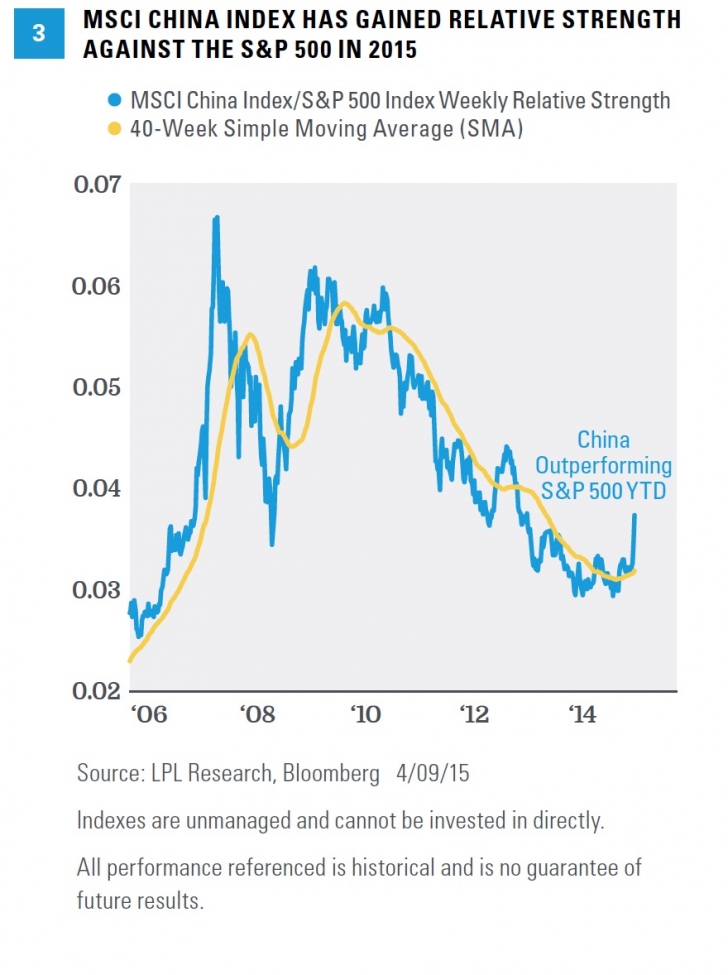
Like broad EM, China’s technical picture has improved significantly this year. The MSCI China Index has begun to show increased relative strength versus the S&P 500 Index [Figure 3] and is showing signs of a potential trend reversal, as exhibited by a positively sloping 40-week simple moving average (SMA). As long as the MSCI China Index/S&P 500 Index relative strength line remains above its 40-week SMA, the moving average will remain positively sloping, which, from a technical perspective, would signal an increased likelihood that the MSCI China Index could continue to outperform U.S. stocks.
CONCLUSION
We maintain our positive view of broad EM with a preference for Asia, but hesitate to upgrade the outlook beyond our slightly positive view. Within Asia, we believe the China opportunity is interesting. Despite strong recent performance, Chinese stocks may see further gains, with a government in stimulus mode, low valuations, improved relative strength, and the new Mutual Market Access program for China and Hong Kong. Despite several risks (traditionally high volatility, corporate governance conflicts, a possible real estate bubble, and a potential “hard landing” for the Chinese economy), China may continue to see stock market opportunities in 2015.
Read/Download the complete report below, or here:
Weekly Market Commentary 04132015
IMPORTANT DISCLOSURES
The opinions voiced in this material are for general information only and are not intended to provide specific advice or recommendations for any individual. To determine which investment(s) may be appropriate for you, consult your financial advisor prior to investing. All performance referenced is historical and is noguarantee of future results.
The economic forecasts set forth in the presentation may not develop as predicted and there can be no guarantee that strategies promoted will be successful. Investing in stock includes numerous specific risks including: the fluctuation of dividend, loss of principal, and potential liquidity of the investment in a falling market. Because of its narrow focus, sector investing will be subject to greater volatility than investing more broadly across many sectors and companies. Investing in foreign securities involves special additional risks. These risks include, but are not limited to, currency risk, political risk, and risk associated with varying accounting standards. Investing in emerging markets may accentuate these risks.
Technical Analysis is a methodology for evaluating securities based on statistics generated by market activity, such as past prices, volume and momentum. Technical analysts do not attempt to measure a security’s intrinsic value, but instead use charts and other tools to identify patterns and trends. Technical analysis carries inherent risk, chief amongst which is that past performance is not indicative of future results.
INDEX DESCRIPTIONS
The Standard & Poor’s 500 Index is a capitalization-weighted index of 500 stocks designed to measure performance of the broad domestic economy through changes in the aggregate market value of 500 stocks representing all major industries.
The Shanghai Stock Exchange Composite Index is a capitalization-weighted index. The index tracks the daily price performance of all A shares and B shares listedon the Shanghai Stock Exchange. The index was developed on December 19, 1990 with a base value of 100. Index trade volume on Q is scaled down by a factor of 1000.
The MSCI China A Index captures large and mid cap representation across China securities listed on the Shanghai and Shenzhen exchanges.
Copyright © LPL Financial


