by James Picerno, Capital Spectator
Warren Buffett last week said that US stocks “might be a little on the high side now, but they’ve not gone into bubble territory.” But the Oracle of Omaha added the standard caveat that “it’s always easier to identify [bubbles] in retrospect.” Does that mean we should refrain from trying to estimate bubble risk in real time? Perhaps, although the devil’s in the details. How you define and look for bubbles are critical factors. Assuming that we”re willing and able to read the data in a comparatively objective manner, searching for bubbles can be productive. But in order to pass the smell test this process should be part of a healthy and diversified risk-management regimen that unfolds in the context of a relatively objective framework. That’s a fairly high bar, but let’s give it a try, if only as an academic exercise.
First, let’s recognize that there’s no silver-bullet solution to estimating bubble risk. Instead, there are a number of useful metrics that deserve regular attention. There are too many possibilities to discuss here, but we can and should start by looking at the market directly. US equities have certainly enjoyed an extraordinarily bullish run since bottoming out in March 2009. The S&P 500 is higher by more than 200% relative to that trough.
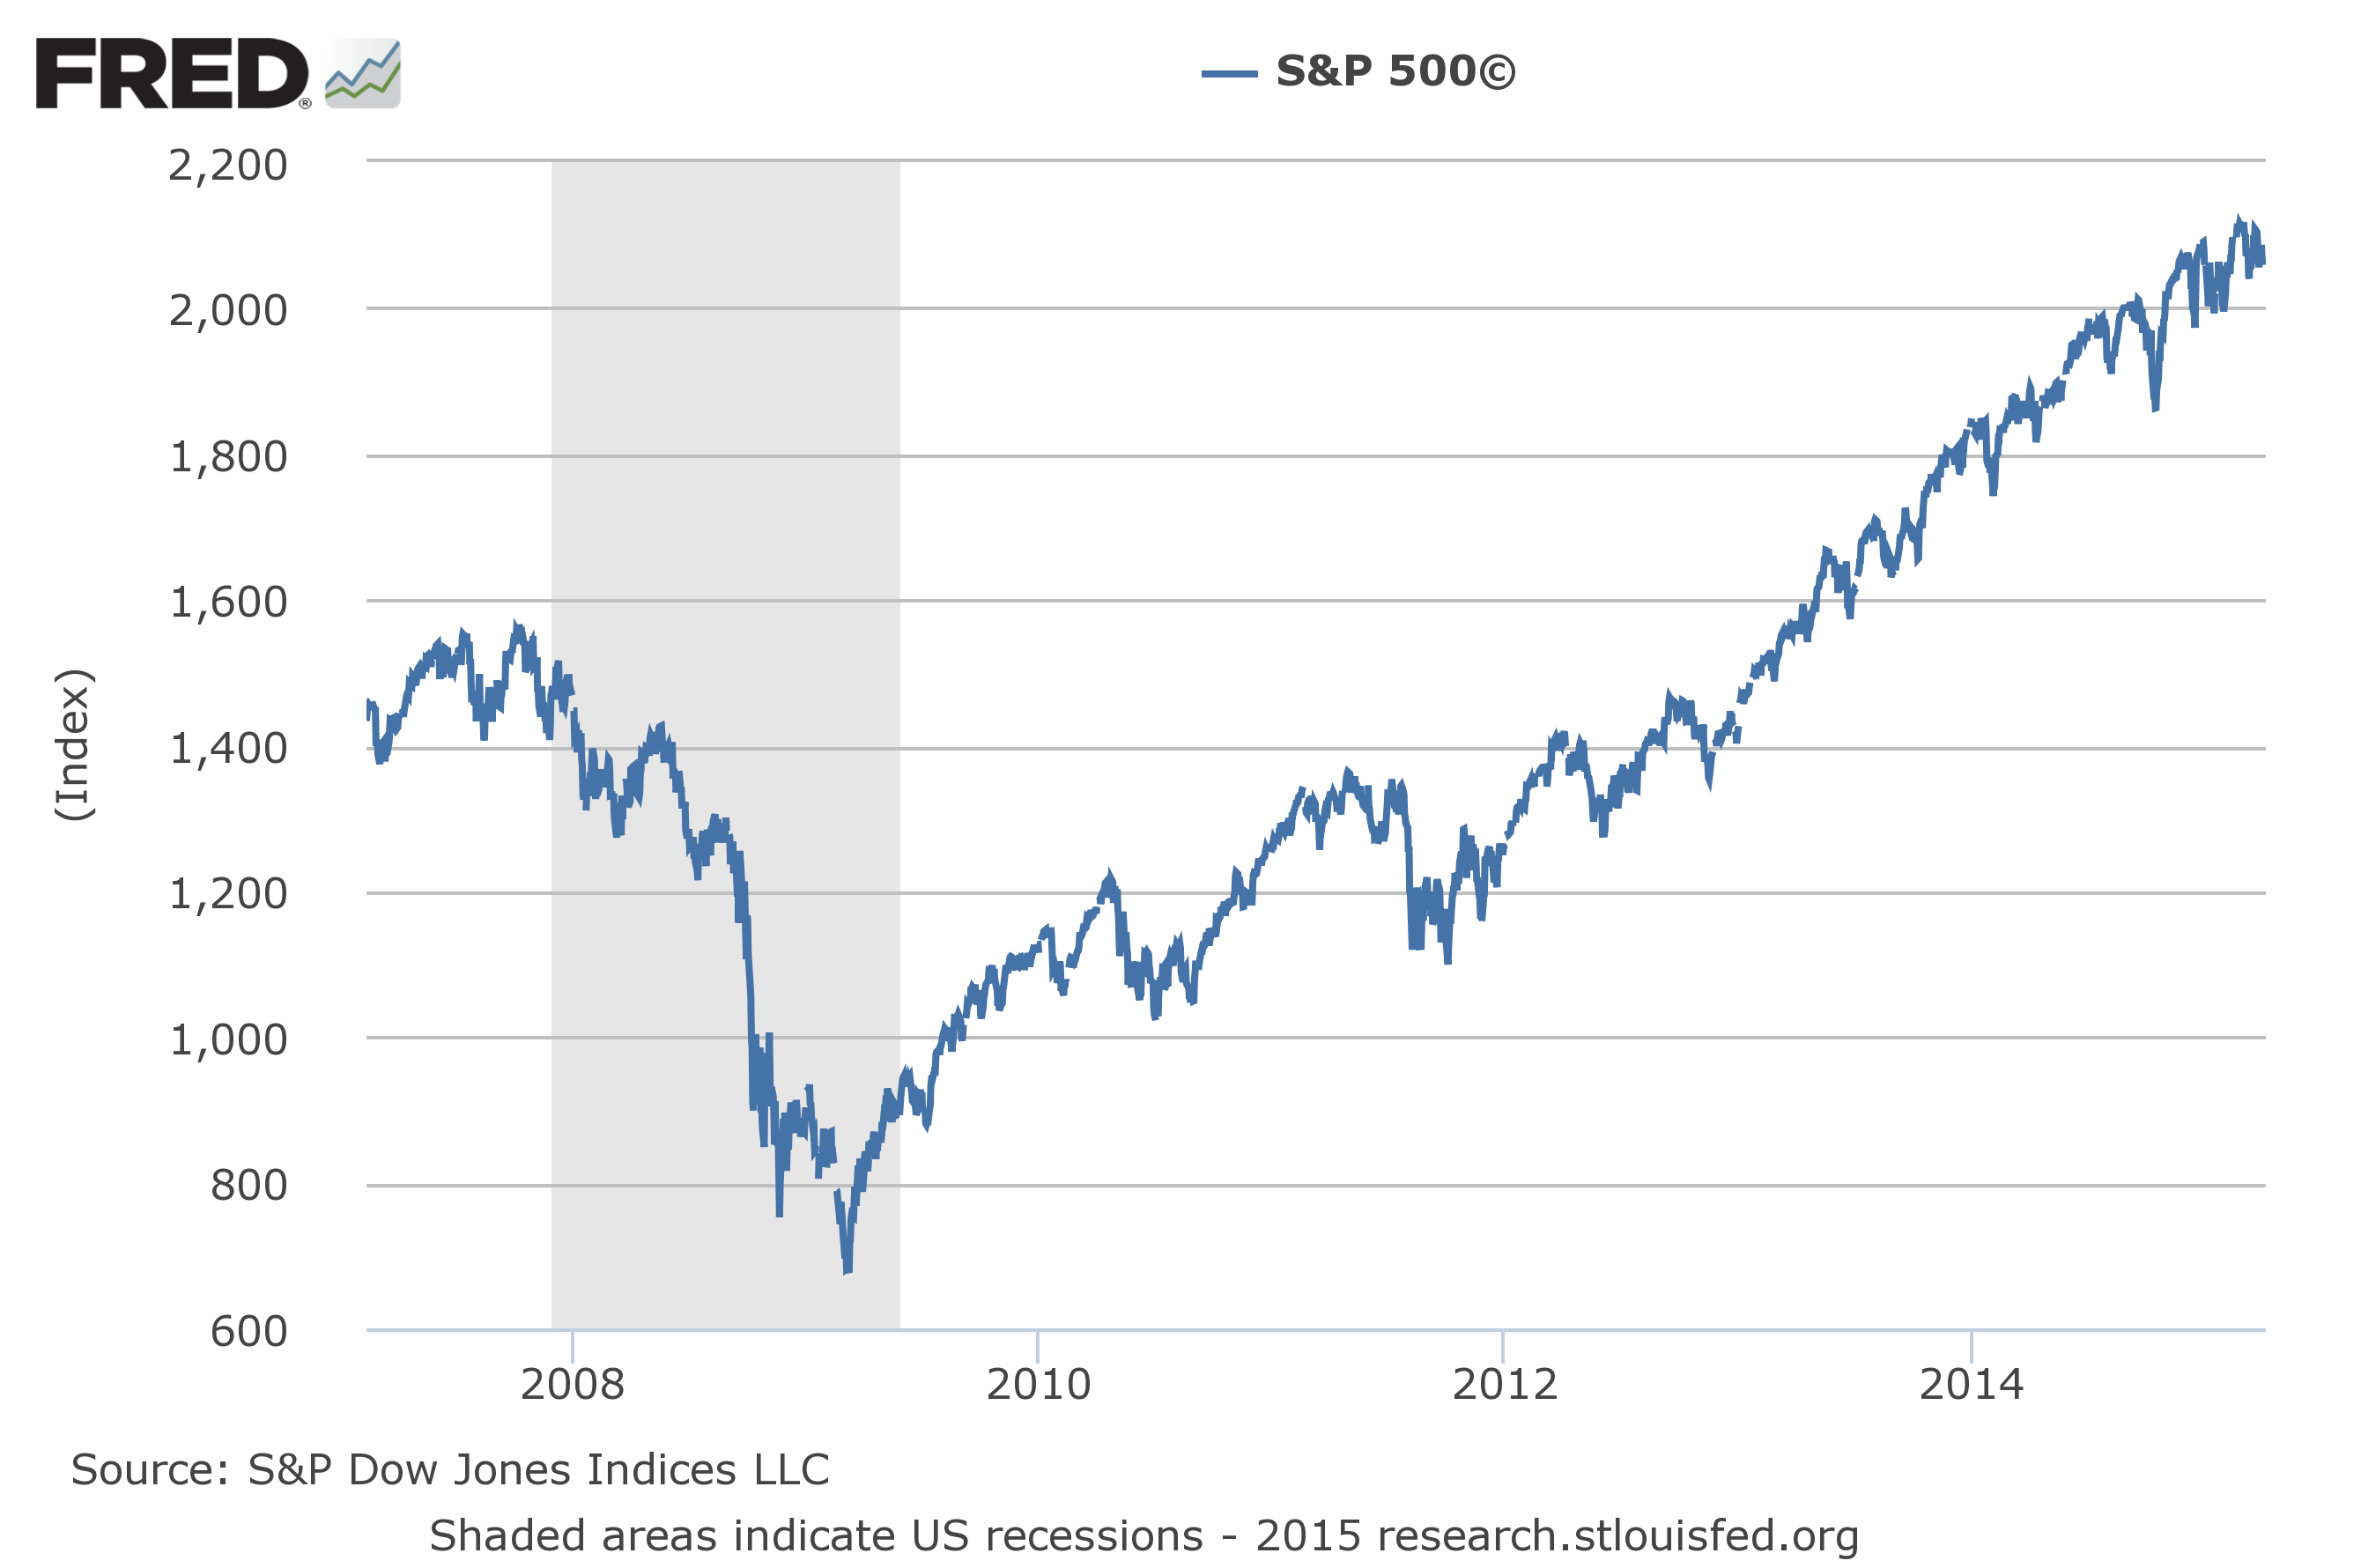
Not surprisingly, equities are no longer inexpensive. But are they overvalued? Maybe, or so one can argue based on the so-called Shiller PE—the cyclically adjusted price-to-earnings (CAPE) ratio for the S&P 500 based on the average of earnings for the trailing ten-year period. According to figures via Professor Shiller’s web site, the S&P 500 CAPE is nearly 27, which is roughly at the 95th percentile relative to this metric’s 134-year history. Bubble territory? Yes, or so a number of analysts advise.

Indeed, Professor Shiller has said as much. Last year (June 2014) he warned that CAPE at 26 “looks like a peak.” Perhaps that was true, but the market has rallied (and CAPE has inched a bit higher) since he made that observation. The generous interpretation is that he was early rather than wrong. Unfortunately for investors, telling the difference is difficult if not impossible in real time.
Or is it? One way to help separate the signal from the noise is to review the numbers through an econometric lens. There are several techniques, including one I’ve discussed previously at CaptialSpectator.com: testing for a unit root in a time series to identify periods when the data becomes non-stationary and exhibits non-random and perhaps explosive behavior in a statistical sense. One approach uses what’s called the Augmented Dickey-Fuller Test (for some background, see this post from last year.) Running the numbers on the S&P through yesterday’s close suggests that the market has become increasingly bubbly lately, although it still falls short of the elevations that reflect a clear and present danger. To be precise, the current p-value (based on a rolling 36-month window of monthly prices and using yesterday’s close as the current data point) has climbed to 0.8, a four-year high.
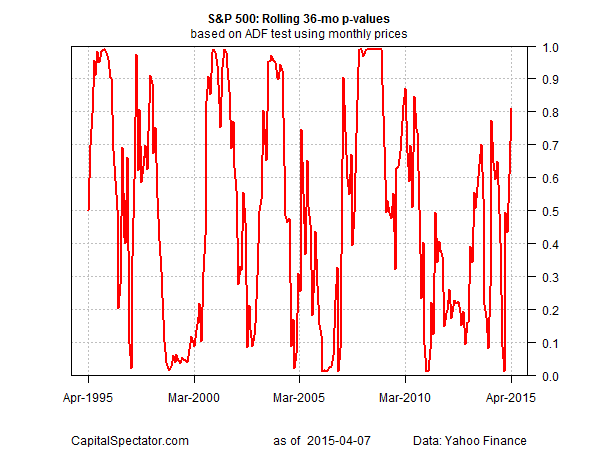
That’s not necessarily a sign that there’s a bubble, even if we’re moving closer to that tipping point. A far more-more ominous level, according to history, would be a p-value at or above 0.95. Not surprisingly, such nose-bleed levels were reached starting in Feb. 2008, providing some advance warning of the market crash that arrived later that year. By this standard, one can argue that the market’s current level is frothy, but still well short of an overt bubble scenario.
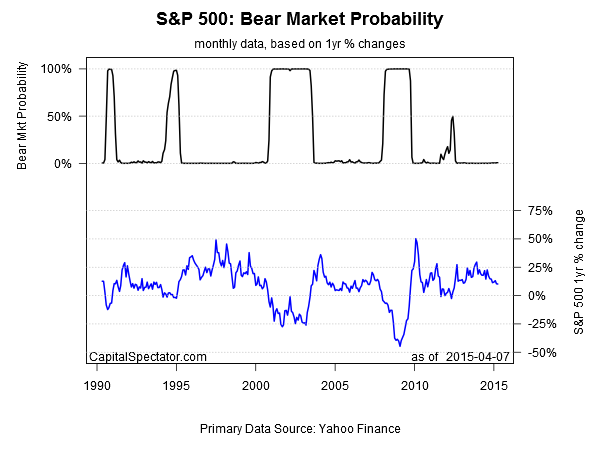
For additional perspective, let’s review how the S&P 500 stacks up in terms of another econometric technique that looks for statistical evidence of a bear market. The toolkit this time is based on a Hidden Markov model, which analyzes market behavior in search of so-called regime shifts via a probabilistic framework. (For some background, see this post here.) Running the numbers through this econometric grinder suggests that the bull market, although somewhat long in the tooth by historical standards, is still alive and kicking.
Does this add up to an ironclad guarantee that US stocks will run higher still? No, of course not. Crashes and corrections are still possible even if there’s no sign of a bubble. Meantime, mere mortals can’t make definitive proclamations on when or if such events will occur in advance. Obvious? Yes, although some pundits conveniently forget this little fact, usually when they’re on TV.
But I digress. What we can say with a reasonable degree of confidence is that the bubbly climate is on the rise and that there’s more froth than we’ve seen in recent years. Risk, in short, is somewhat elevated. What does that imply? Taking some profits, of course, and otherwise considering the rebalancing opportunities across the major asset classes with an eye on expected returns.
Meantime, the point of the analysis above is to provide some perspective, which isn’t the same thing as knowing the future. But that’s the nature of risk management: making intelligent choices with limited and perhaps flawed information about what happens next.
Then again, you don’t need a model to tell you that downsizing risk levels after a long bull market is just plain common sense. Dramatic, sudden changes in asset allocation are almost always ill-advised, but going to sleep and assuming that stocks will continue to rise for some indefinite period can be hazardous to one’s wealth at times too. As usual, enlightened money management resides somewhere between the extremes. Fortunately, we don’t need to run a set of sophisticated analytics to figure out what constitutes a reasonable, middle-of-the-road path for portfolio design and management.
Copyright © Capital Spectator