
The Drop in 2015 S&P 500 Earnings Estimates Has Been Pretty Sharp.
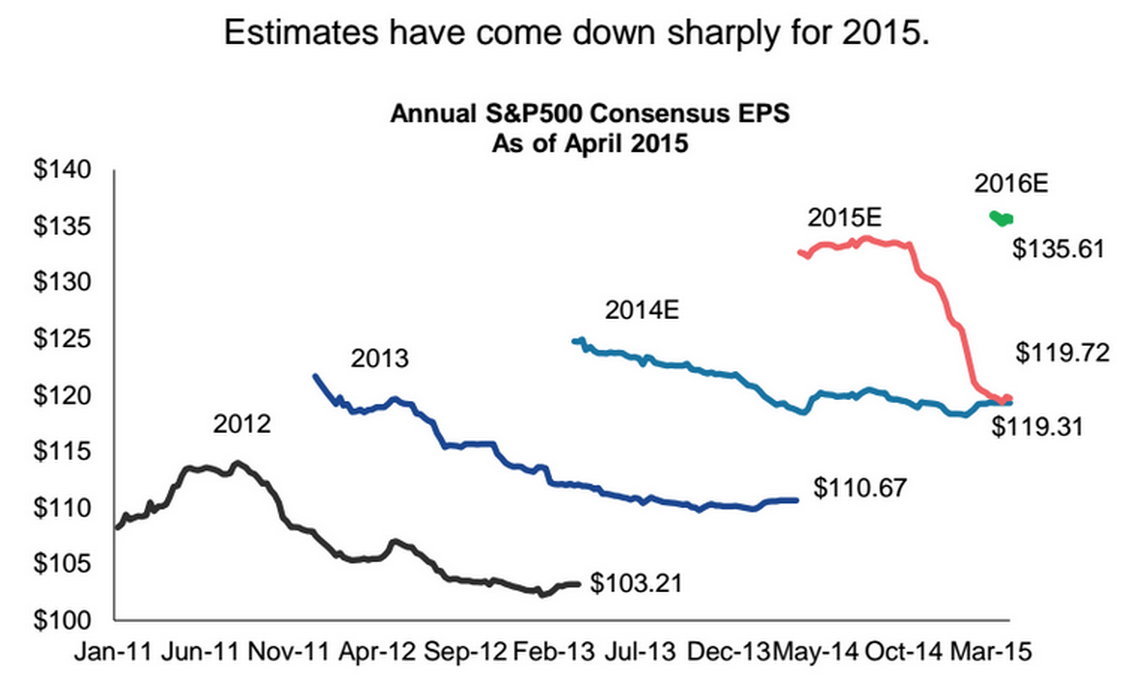
This chart essentially shows how EPS estimates have changed over the years. A common trend, for example, seems to be that companies and analysts over promise early in the year but then cut estimates as the year proceeds. This, perhaps, is a classic example of the Overconfidence Bias.
One interesting thing to note about this year, however, and something that makes it different from previous years, is the steepness in EPS cuts. The red line has gone from almost $135 to now $119. Or a 12% haircut in EPS estimates.
We’ll soon find out if this chart plays out as expected. Several big banks like Wells Fargo, Citi, and Goldman Sachs report earnings next week. Get ready.