
With much talk about the Emerging Markets recently, for this weeks edition of the SIA Equity Leaders Weekly, we are going to look at two countries which dominate over 75% of the Favored zone within the SIA International Equity Emerging Markets report: China and India. The Emerging stocks gained strength this week, specifically Wednesday after Chinese factory and services activity came out ahead of most forecasts. With so much apparent ETF duplication and choice between the two countries, we are going to have a look at FXI and EPI which have extremely high trading volume, offering sought-after liquidity.
iShares China Large-Cap ETF (FXI)
Of the 31 ETFs included within the International Equity Emerging Markets report, 15 have exposure to China. These US traded ETFs include an array of choices such as large-cap names, small-cap, Technology, Financials, Real Estate, and Industrials.
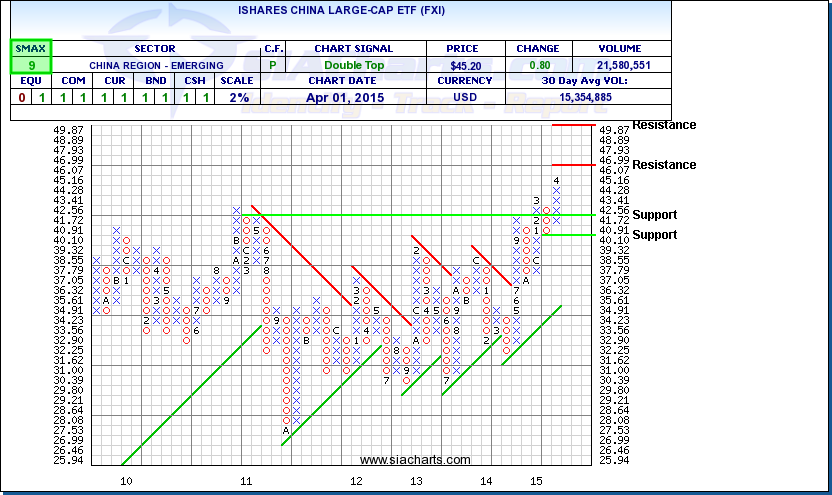
If looking for exposure to large companies in China, iShares China Large-Cap ETF (FXI) offers access to 50 of the largest Chinese stocks in a single fund. The 50 companies contained in this ETF trade on the Hong Kong Stock Exchange, and the ETF itself sees tremendous daily volume, averaging over $500,000,000 per day.
As can be seen from the chart, FXI has recently broke through resistance at $44 and will possibly test new resistance at all-time highs around $46, and $50. To the downside, support is now found at $41.72 and then lower at around $40. With an SMAX of 9, FXI is showing near-term strength against all asset classes.
Click on Image to Enlarge
WisdomTree India Earnings Fund (EPI)
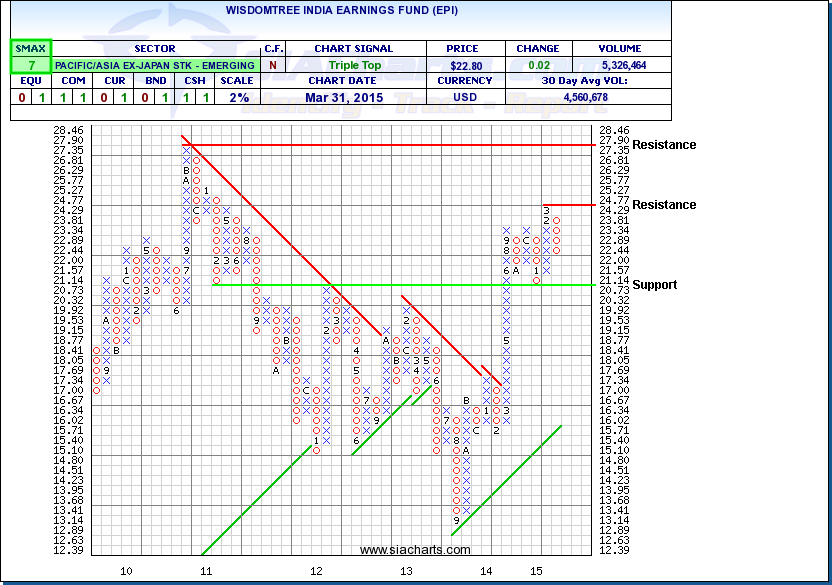
Again looking at our Favored list of Emerging Market ETF's, 30% of them give exposure to India: large-cap, small-cap, and infrastructure names are included. From speaking to many IA's I know there is a reluctance to participate in this strong performing sector for a number of reasons, but liquidity should not be one of them. Looking at Wisdom Tree's India Earnings Fund (EPI), which averages over $62,000,000 in trading volume per day, gives investors exposure to an earnings-weighted index of companies listed in India.
From the chart of EPI you can see that after the major rally last year from March to September, the ETF consolidated sideways for the past 5 months. Still showing near-term strength against most asset classes with an SMAX of 7, EPI will need to either break resistance at $24.77, or support at $20.73 in order to break free on this half year trading band.
Click on Image to Enlarge
SIACharts.com specifically represents that it does not give investment advice or advocate the purchase or sale of any security or investment. None of the information contained in this website or document constitutes an offer to sell or the solicitation of an offer to buy any security or other investment or an offer to provide investment services of any kind. Neither SIACharts.com (FundCharts Inc.) nor its third party content providers shall be liable for any errors, inaccuracies or delays in content, or for any actions taken in reliance thereon.
Any questions or to learn more about these relationships, other Commodities, or other information, please call or email us at 1-877-668-1332 or siateam@siacharts.com.
Copyright © SIACharts.com