by Erik Swarts, Market Anthropology
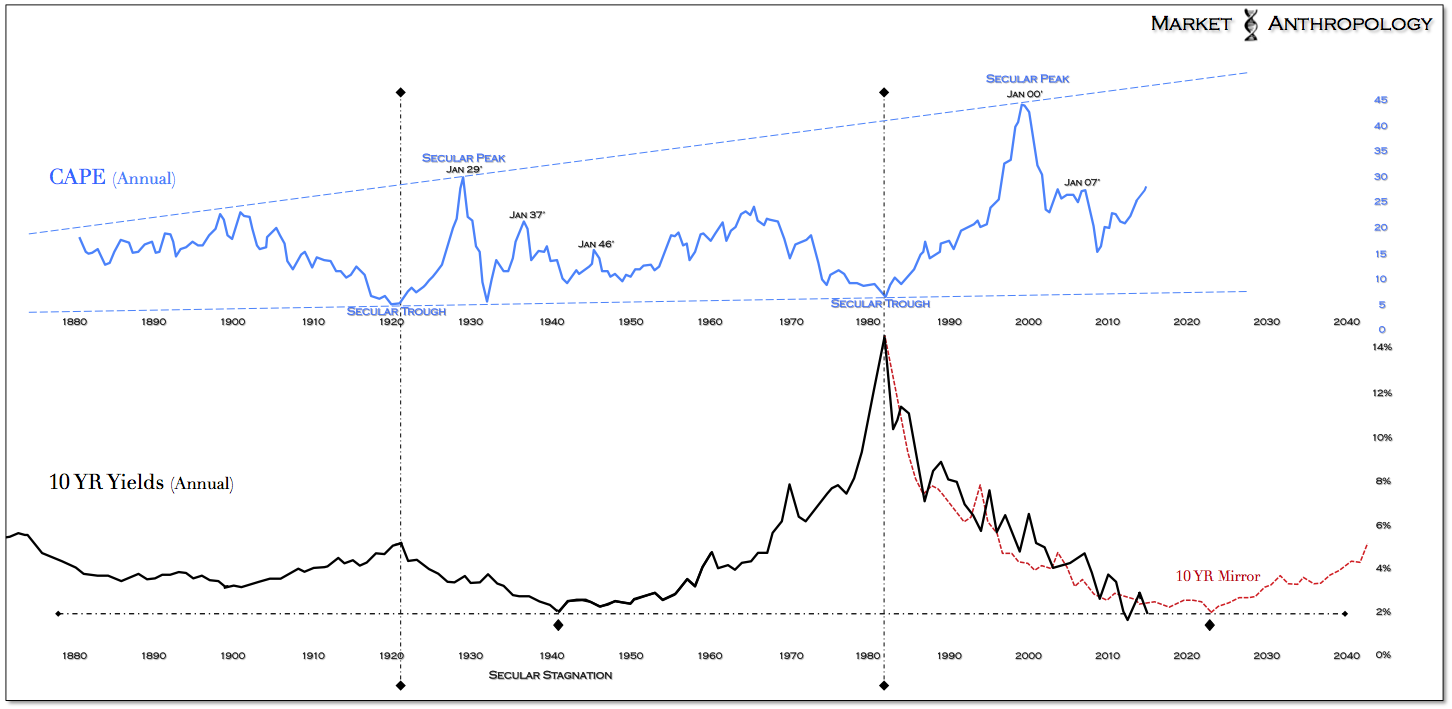
 [dropcap]W[/dropcap]ith the U.S. equity markets continuing to make and trade near their all-time highs, and as the U.S economy further distinguishes itself as the best street in an otherwise downtrodden neighborhood, it's easy to get lost in the minutia of yet another Fed meeting deliberating a strong dollar and future rate hikes - and forget where we currently reside in the trough of the long-term yield cycle and the considerable history that brought us to this point. Looking back at the span of the broader cycle, you'll find it was a period in history that encompasses 70+ years of remarkable growth - the last 30+ of which were traveled with increasingly benevolent credit conditions, in which the U.S. has enjoyed elevated equity market valuations on the back of a proportionately massive secular downdraft in yields.
Click to enlarge Figures
 |
| Figure 1 |
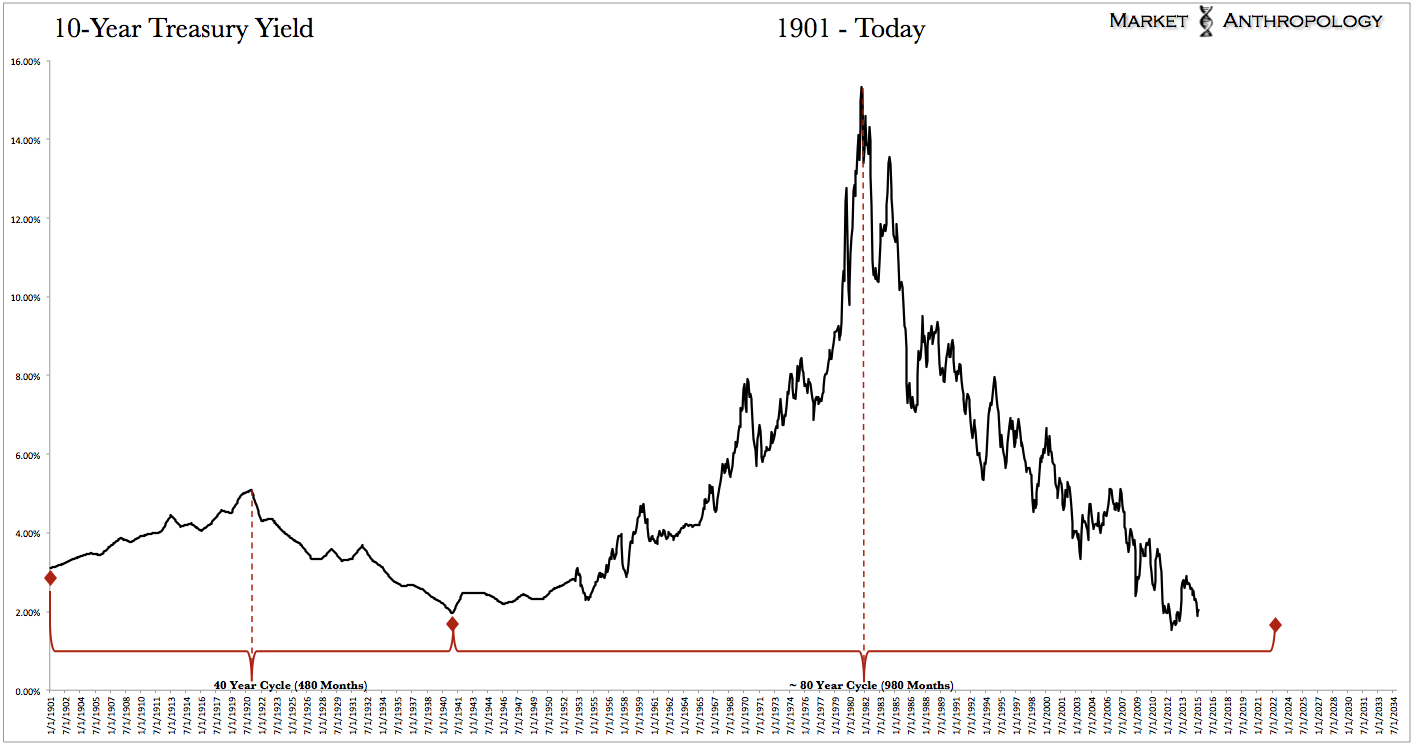
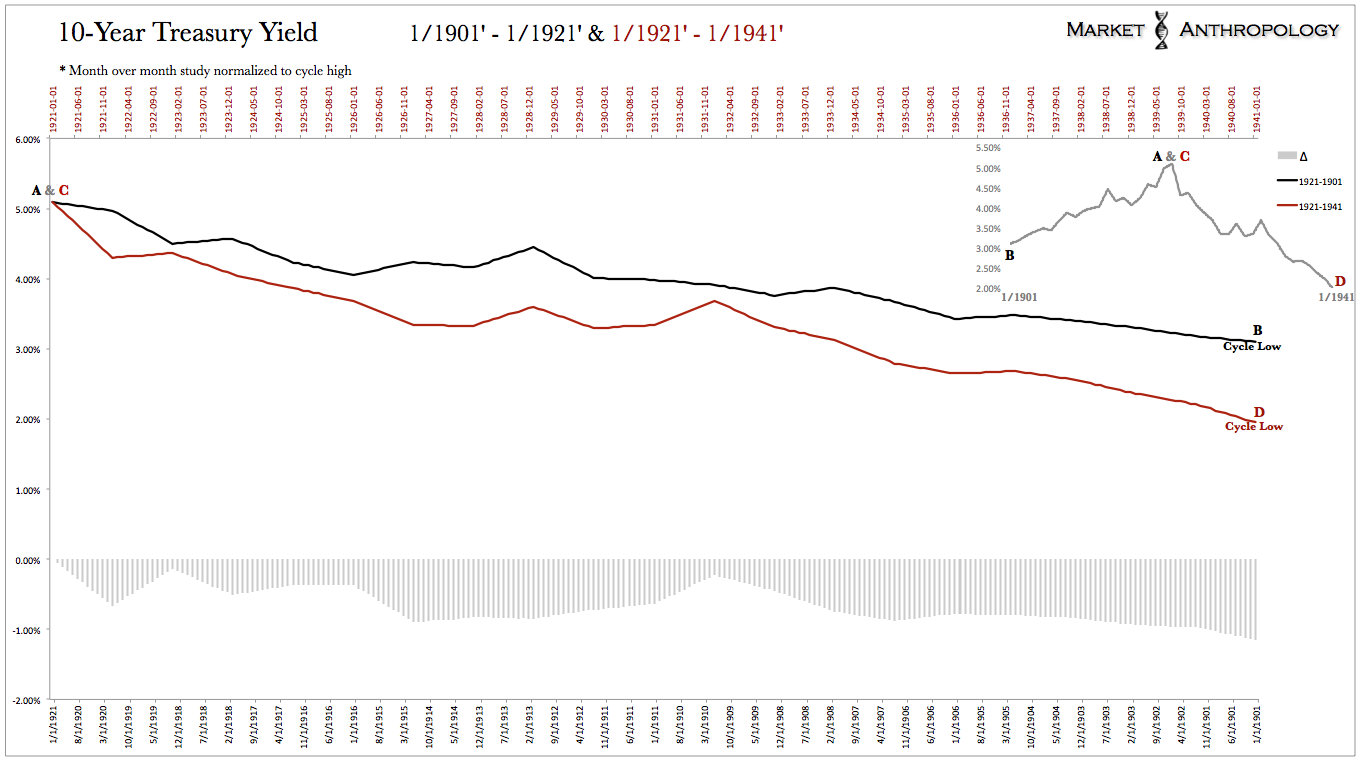
Historically speaking, the significant investments and advancements in the world economy that took place directly after World War II, helped drive growth - inflation and eventually yields to such icarus heights, that countries, corporations and individuals have enjoyed the voluminous book-end benefits of a declining rate environment for well over 30 years. Comparatively, the secular peak in yields in 1981 was over three times as high as the previous secular peak in 1921 - and the broader span from trough to trough of the current move (1941-2021' ~80 years) will likely be over twice the previous cycles length (1901-1941'). Simply put, there's a lot of debt out there in the world. Raising rates here at home in the U.S. will have significant knock on effects throughout the financial markets - especially if the balance of the world is aggressively easing monetary policy. Believing that the broader system can normalize and reboot to the next long-term cycle without a prolonged period of transition (i.e. some call it secular stagnation - we like transitional divide) - even proportional and commensurate with the previous trough, is illogical even along the irrational continuum we often find ourselves walking out on.
The underlying takeaway for us, is that participant expectations - as well as most members of the FOMC, have found themselves significantly ahead of reality when it comes to the prospect of rate hikes. This has been one of the main drivers of the dollar's moonshot over the past eight months, which has been motivated by persistent expectations of a more traditional tightening regime normalizing policy (as it has in recent past), while the rest of the world opens their monetary spigots. Over the past two years, by the FOMC's own telegraphed forecasts to the market, they have speculated that short-term rates would rise above ZIRP to around three percent by 2017. In our opinion, this outcome remains exceedingly optimistic when you consider the long-term yield cycle and what we can glean about the trough from the previous cycle.
 |
| Figure 2 |
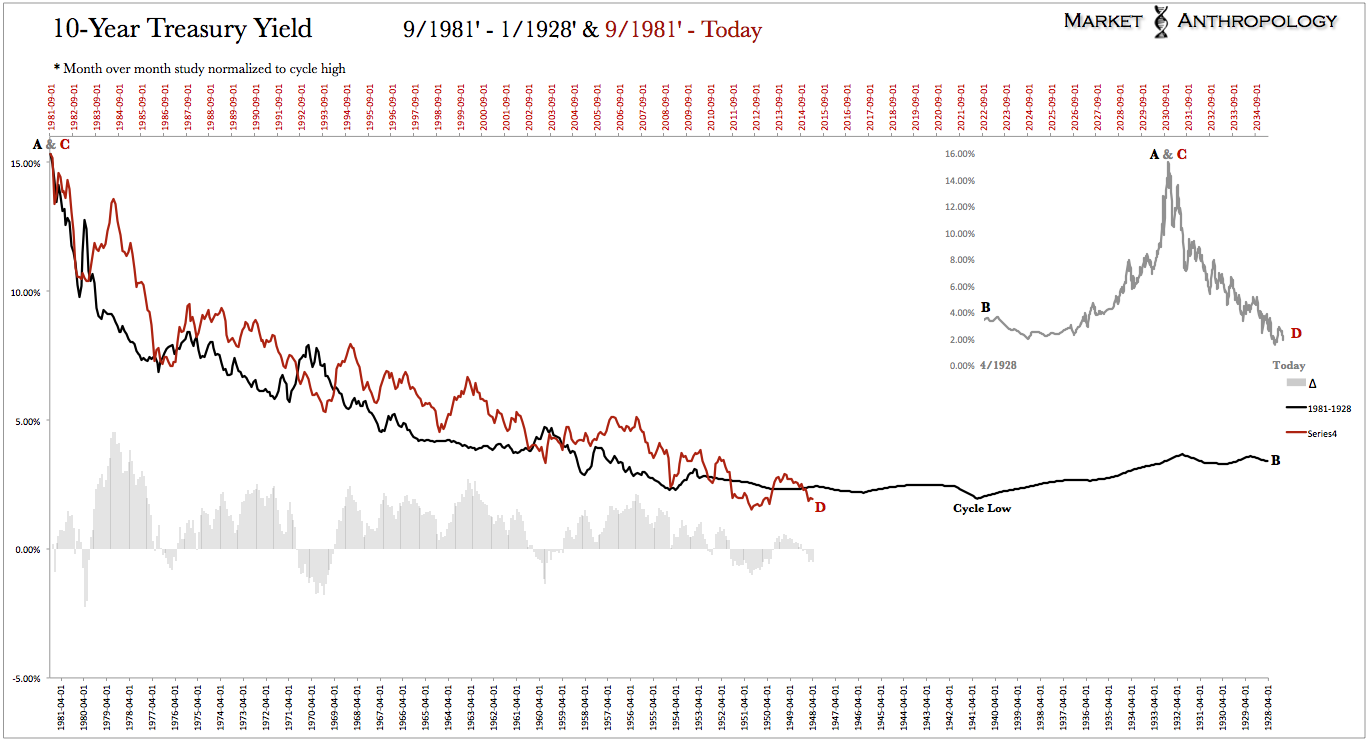
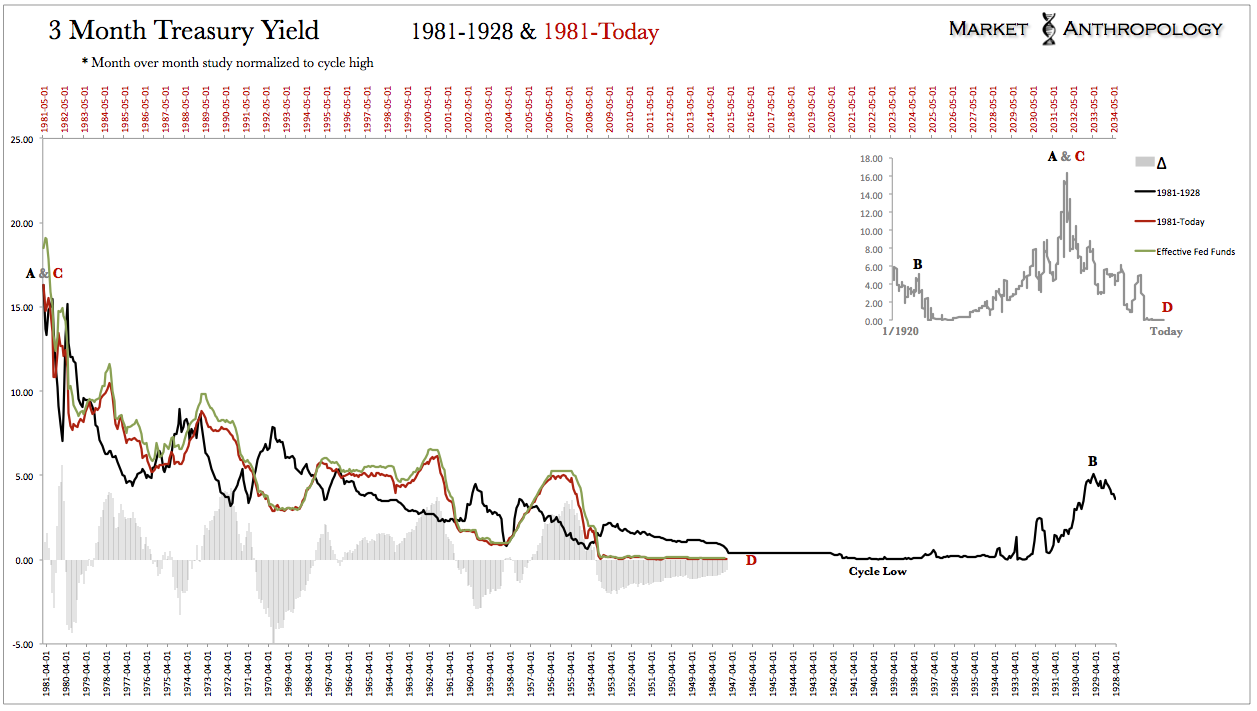
Over the past four years since we first started sharing our thoughts on the market, we've commented on the relative symmetrical retracement in yields from their secular peak in 1981, extrapolating a mirrored projection that has rightfully guided our future expectations of lower for longer. Many times, complexity can be distilled with a simple solution or explanation. Einstein's genius frequently displayed this kind of elegance. "It is the theory that describes what we observe", he said - and his theories were as elegant as his understanding brilliant. Along those lines, although admittedly less brilliant (but certainly simple), we've observed great symmetry in the rise and return of the long-term yield cycle, with the basic theory that the return would be commensurate with the rise - as markets and economies wrangled with the complex and interconnected webs of their respective credit and growth cycles.
 |
| Figure 3 |
 |
| Figure 4 |
Interestingly, the relative symmetry represented in the current yield cycle is not unusual and quite characteristic when you look back at history. The previous cycle (from trough to trough) spanned 40 years to the month; a period in which yields rose for 20 years - followed by a 20 year decline. Unlike the current downtrend in yields that has trended to the trough with increasingly more symmetry with the mirrored rise in yields from 1941 to 1981, the previous cycle exhibited an asymmetric return below the 1901 lows, as economies pushed up against the limits and unbalances exposed and magnified during the great depression - and markets stumbled their way across the transitional divide to the next growth cycle.
 |
| Figure 5 |
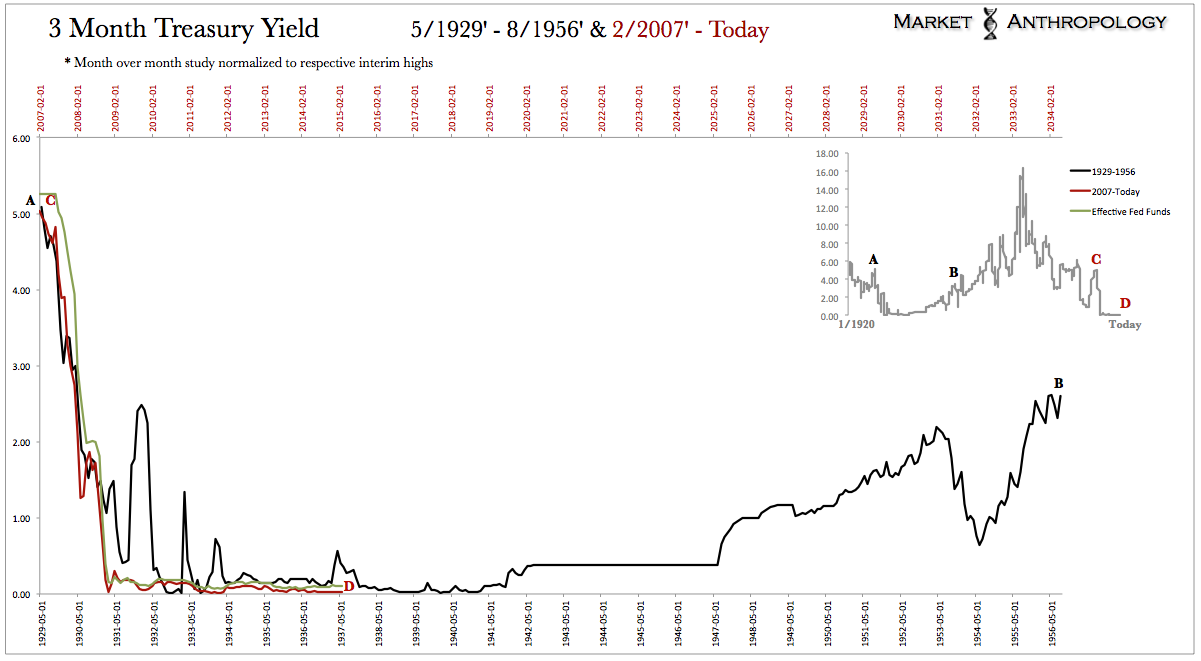
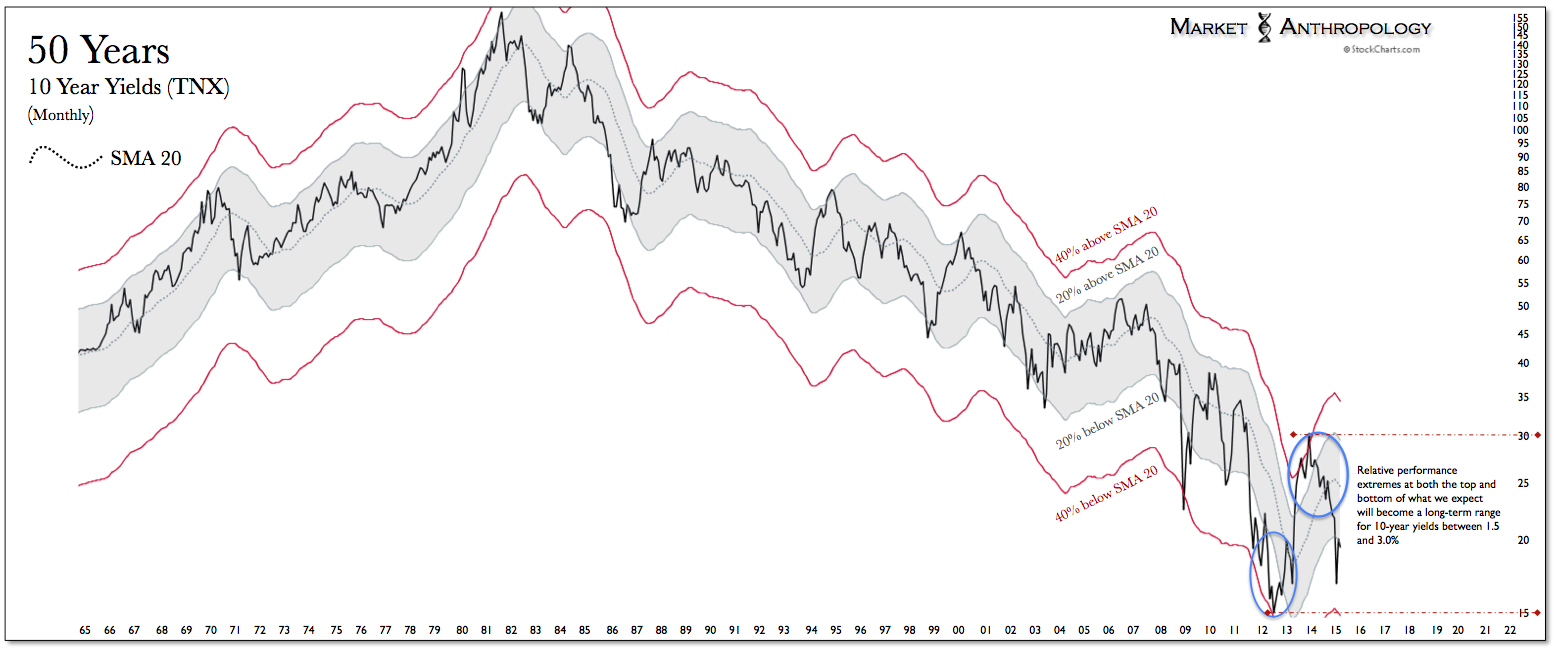
When we approach future market expectations from a comparative perspective of low yields facilitated by extraordinary monetary policies following a financial/debt crisis, you arrive at a similar appraisal with the mirrored return profile - in that yields will be low for the foreseeable future. Even for long-term investors, patient may well prove to be an understatement when it comes to the length of the broader cycle's trough. As shown above in Figures 3 and 4 - and especially evident below in Figure 6, the historic profile of the previous trough throws cold water on expectations that the Fed will be capable of raising the fed funds rate to ~ 3 percent by 2017 - or even 2027. Moreover, if our theory that the broader cycles "size matters" and influences the proportions of the return, it should be noted that the previous trough in yields followed a significantly smaller secular peak and cycle. All things considered, while they may look to raise rates marginally off ZIRP over the next year, expectations are still too damn high with respect to the magnitude of the potential move. Nevertheless, as mentioned in previous notes and implied by the mirrored return and historic analogs, we would still estimate that risk over the intermediate-term is for higher yields. The difference, however, is that we do not expect a sustained move higher - and would look for a trough range to continue to develop, with a mid-point ~ 2.25% for the 10-year.
 |
| Figure 6 |
In many ways - although the Fed likely had good intentions at the time and was dealt a very difficult hand to play, their increasingly transparent policy approach with the market appears to have severely limited their capacity to act - as misplaced as it may be these days. With the majority of the worlds largest central banks continuing to ease aggressively, while rate hike expectations in the U.S. remain steadfast, the dollar has reached a level in such a short period of time that it now limits the Fed's ability to tighten without causing serious dislocations and distortions around the world - that would inevitably reach back with known and unknown consequence in the U.S. Although the consensus opinion in the market is that the dollar is on a secular updraft that could continue for years, considering the strong ties of globalization that bond us with the world and proportions and profile of the long-term yield/growth/debt cycles - in our opinion, those expectations are as misplaced as looking for a secular rise in yields today.
As mentioned in previous notes, we expect the dollar to once again modulate and follow last years move in yields back down into the trough of its long-term range, as expectations come in with regards to the magnitude and timing of potential rate hikes and as markets slowly transition and stumble their way across the transitional divide to the next growth cycle. Despite it's current disposition - and contrary to popular opinion in the market these days, we expect lower for longer will eventually apply to the world's primary reserve currency as well. If not, the Fed's haunting specter over the past two decades - that of deflation, will eventually drift over onto our shores. That said, we suspect it will be more of a push and pull with cyclical inflationary and disinflationary moves across the transitional divide, with the markets currently situated for another reflationary upturn.
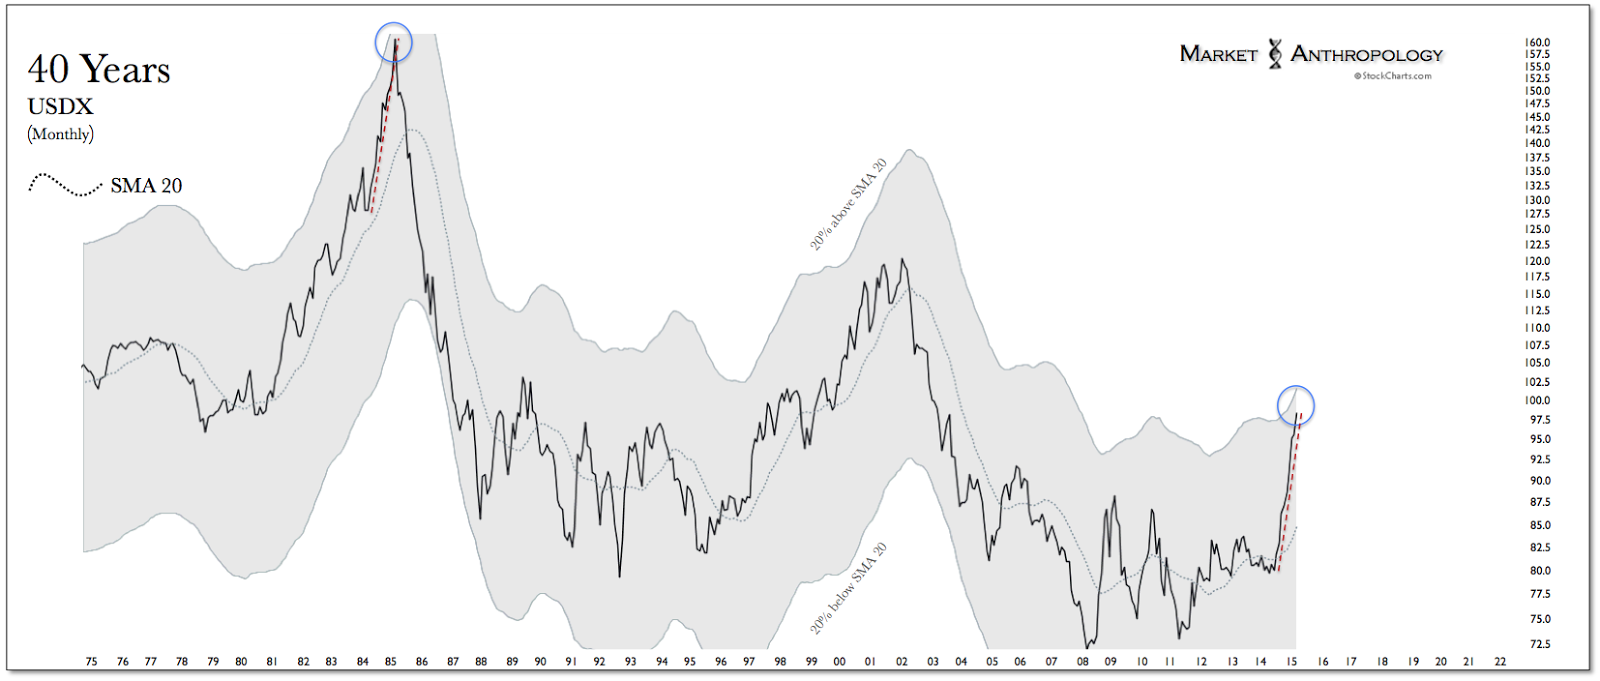
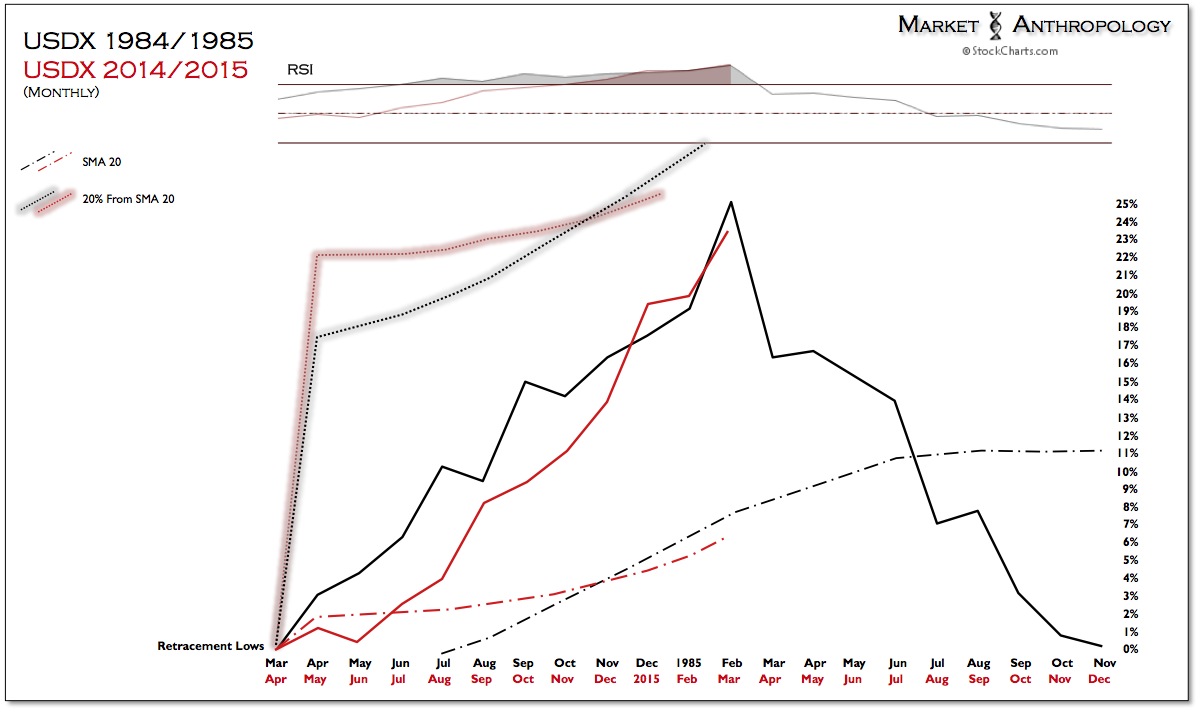
To a large degree this relies on the trend of the two largest reserve currencies in the world (dollar/euro), which from a long-term performance perspective of its proxy (U.S. dollar index) - is almost as stretched as it was at its secular peak in February 1985.
 |
| Figure 7 |
Similar to the relative performance extreme registered in 10-year yields at the end of 2013 (which was also the closest move from a relative performance perspective with its secular peak in 1981), the USDX may be poised to complete a more symmetrical retracement of the potential blowoff move in the dollar that began last spring. If so, Treasury Secretary Lew's "strong dollar/strong U.S" will be just a faded memory come Christmas and a potential foreboding premonition for what has been leading strength in U.S. markets over the past several years.
 |
| Figure 8 |
 |
| Figure 9 |
Copyright © Market Anthropology


