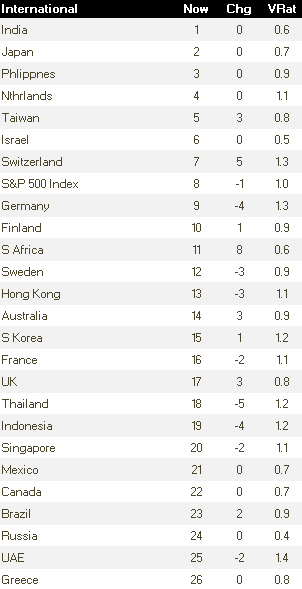
 A look at global relative strength
by Adam Grimes
Where do we start? It’s easy to get overwhelmed with the number of assets and markets in the global marketplace. Are you looking at everything you need to? Do you know which markets demand your attention? Do you know where to dig deeper? Do you know when something might be changing? These are important questions, and one of my first tasks, each time I turn to the market, is to start with a look at global relative strength.
The table to the left is drawn from my weekly research reports I write for Waverly Advisors, and includes the major international indexes (in USD) that we follow. These are ranked by a front-weighted, multi-period RS measure. The “Chg” column shows the change in ranking from one week to another; I think it is important to be aware of big changes here. If something has moved 10 spots or more in this ranking of 26 major markets, you at least want to know why.1
Consider this a first look, high level perspective on global stocks. If you start with a list like this, you can cut through all the information and hype and see what is actually strong and weak around the world. As for what you do with that information, it depends. My next step is to consider this type of information looking at markets divided by Developed and Emerging status, and then also to consider geographies. From all of this, a comprehensive picture of risk and opportunity begins to develop.
There are many ways to create a screen like this, and many ways to make use of this information. This is one particular application that I have found useful over the course of my career, but take the concept and run with it. (If you want to see what I do with it, we would like to offer you a free trial of my daily research.) Once you’ve narrowed down your areas of focus, then you can drill further, for instance, perhaps looking at sector and industry divisions within specific markets, and then drilling down to individual stocks.
Trading and investing is a mix of Art and Science, but both depend on having the right raw materials and the right tools at your disposal. Relative strength and shifts in relative strength are powerful tools to have at your disposal as you look for opportunity and seek to manage risk in the global marketplace.
- The “VRat” column shows the ratio of current volatility to the longer-term baseline for that market. In a glance, it can show you which markets are quiet and which are currently volatile.
Copyright © Adam Grimes


