
Where Do Stocks Go From Here?
by Michael Batnick, The Irrelevant Investor
After six years of virtually uninterrupted gains, people are wondering where we go from here.
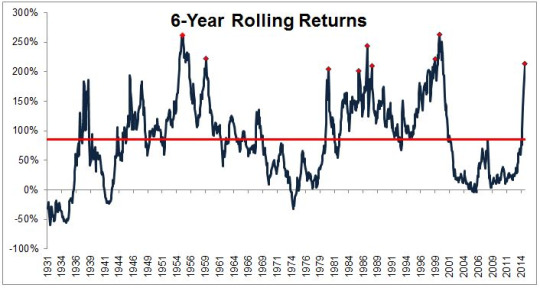
Stocks are up more than 200% over the last six years which is the best six-year run since the tech bubble. Looking at the chart, we see that we are well above the 85% historical average. Once stocks have achieved this level of success, returns going forward have declined.
There have been 54 prior periods where six year returns were greater than 200%. The average return over the next three years was 9% (median 20%) compared with an average historical three-year return of 38%. Furthermore, following these strong runs, we have seen negative three-year returns 35% of the time compared with the 17% negative three-year returns that we have seen historically. So, three-year returns following such a strong run have been one quarter of the average three-year return with negative returns occurring twice as often as we have seen historically.
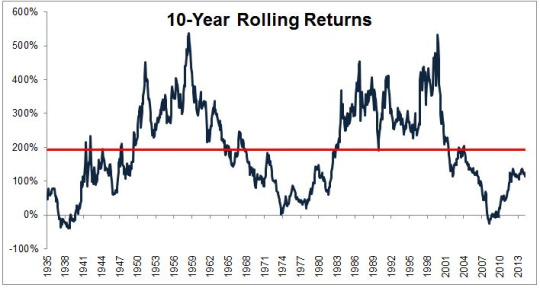
While there might be reason to be cautious looking back over the last six years, when we take a step back the picture starts to change. Over the last ten years, stocks have gained 115% which is just 60% of the historical average ten-year return of 192%.
What do we do when we get conflicting data? Should you adjust the way you invest based on recent history? Nobody can answer these question besides for you. However, my personal opinion is that it probably makes more sense to adjust your expectations than to make radical changes to your portfolio.
*Stocks represented by CRSP 1-10 Index (Data provided by Returns 2.0 via DFA)
Copyright © The Irrelevant Investor