5 Reasons Why the Nasdaq is Different 15 Years After the Bubble
"The markets are the same now as they were five to ten years ago because they keep changing, just like they did then" Ed Seykota
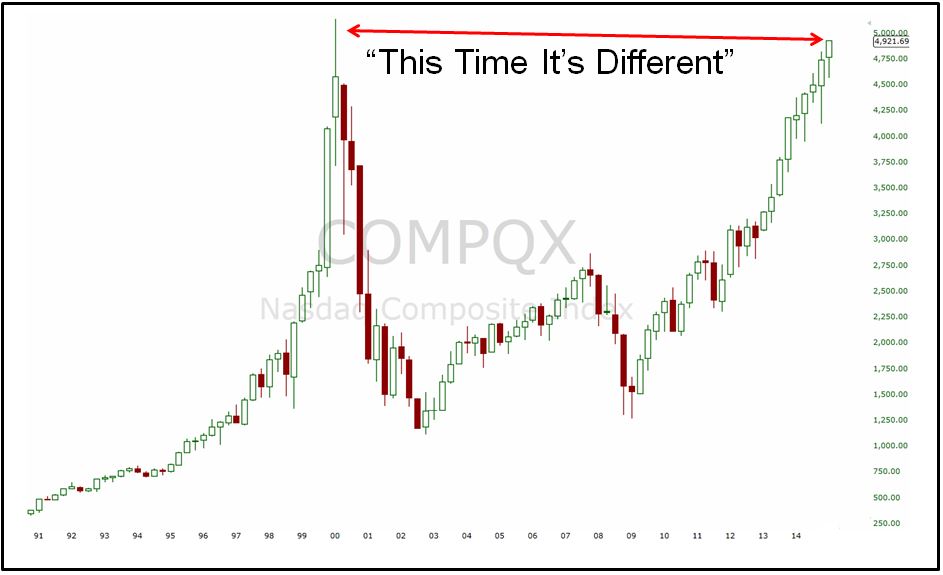
As the Nasdaq Composite looks to make new all-time highs, some market participants just aren’t having it, throwing around the old “I guess this time it’s different.” Now given the fact that the index experienced a nearly eighty percent crash the last time we were at these levels, it’s understandable why some people are so anchored to those previous highs. But the truth of the matter is things are different this time, as they are every time. Let’s examine…
The Economic Landscape
In March 2000, the 10-year treasury was yielding 6.2%, inflation was running at 3.8% and the unemployment rate was at the lowest level in thirty years. Today, the 10-year yields around 2%, inflation is virtually nonexistent at 0.6% and the unemployment rate still has not fully recovered from pre-recession levels.
Performance leading up to the peak
In the seven years from 1991 through 1997, the index appreciated by nearly four hundred percent. And after that spectacular seven year run, it doubled in 1998. And then it doubled again in 1999.
During the dot-com bubble, the Nasdaq 100 went from 1,100 to 4,400 in just nineteen months. This time around it took seventy-two months.
Size and valuation
At its peak the Nasdaq Composite was trading at 500x earnings versus 31x today.
Shifting gears to the Nasdaq 100, which has more than $50 billion in ETFs tracking it, we see the index is now much more tilted to large cap stocks. The total market cap of the Nasdaq 100 (in billions) was $2,218 in 2000 and $4,822 as of December 2014. Furthermore, the smallest company in the index today has a market cap of $7 billion and the average market cap is $48 billion. For comparison, the average size of an S&P 500 company is $38 billion.
The actual construction of the index
At its peak, technology stocks represented 70% of the index, today they are 55%. Healthcare now makes up 15% of the index, up from just 5% in 2000. Today the dividend yield on the index is 1.1% which is one thousand percent higher than it was just a decade ago.
The individual components of the index
Kraft, Staples, American Airlines, Bed Bath and Beyond, Whole Foods and Tractor Supply, to name a few. These are not very reminiscent of the revenue-less high fliers from the dot com days.
So…
If you’re trying to scare people, the parallels are striking. If you’re objective, well, they’re not. When Sir John Templeton said the four most expensive words he was referring to fear and greed and the constant nature in which investors behave. If he were alive today, what he would most certainly not have done is throw up a fifty year arithmetic chart, draw a line and scoff “I guess this time it’s different.”
I’m sure the naysayers were saying the same things back in 1954 when stocks finally made new highs after twenty five years of zero returns. Spoiler, it was different that time and stocks never looked back.
Further reading: The Nasdaq-100 Turns 30
Copyright © The Irrelevant Investor