

by Salil Mehta, Statistical Ideas
Volatility has been a seductive muse for investors, since the global financial crisis. First there was way too much. Then for two years, there just wasn't enough. Now, no one knows (with reasonable certainty). Last Friday (February 13), the U.S. volatility index closed below 15%. The previous time that this occurred was during Christmas week. Would you dare buy any financial products now, to hedge your portfolio risk's risk, or to express the view that volatility will rise from here? It's tempting to be sure. A volatility rise from 15%, to say a typical level of 18%, is a desirable 20% gain (18/15-1). Any sort of investor however, tempted to use any derivative products to express this view, should be vigilant. In particular, despite the seeming promise of these easy-to-buy products, even for short-term right-way trades, this article will explore the insidious returns instead that volatility ETF products will have on your portfolio.
To lay some groundwork, we look at specific returns on the VIX volatility index since May 2011, when six specific investment vehicles have jointly been available. First we look at 9 scenarios where the volatility closed below 15%, through to the time when the volatility again closed above 18%. These are reasonable triggers based on the past range of the index. The 9 scenarios range in duration from as little as 5 trading days, to 167 trading days (~8 months).
Next we explore 4 additional scenarios where the volatility closed above 23%, through to the time when the volatility closed below 18%. This is slightly wider than a 21% decline (18/23-1). But otherwise on par with the difference we noted in the first paragraph (>20%). The 4 scenarios range in duration from as little as 2 trading days, to 130 trading days (~6 months). Now all 13 scenarios are obviously mutually exclusive of one another. See the illustration below.
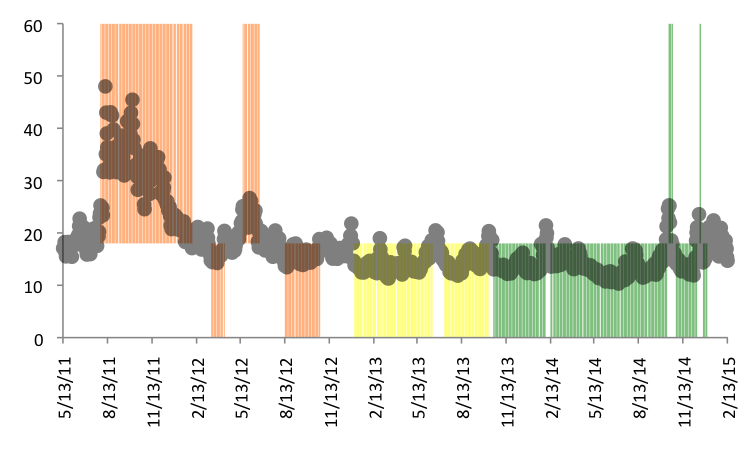
We also color fragment the entire 45-month history shown, into three successive and completely exhaustive subperiods. This was done so that the distribution of investment product returns can be understood better, particular if we notice different regimes across our entire 45-month period. The first subperiod is 18 months, illustrated in orange. The second subperiod is 11 months, illustrated in yellow. Note that in February 2013, we had a momentary VIX spike over 18%, followed by a plunge on the same index below 15%. This two-day gap is described here, though not visible with the naked eye, on the chart above. The last subperiod is 16 months, illustrated in green.
Now in this chart below we show the returns for the first 9 scenarios we previously noted (and we can see on the bottom of the chart above that there are 2 orange, 3 yellow, and 4 green scenarios.) The financial products that could have been used to express a view that volatility would rise are: UVXY, and VXX.

Despite volatility rising at least 20% again (18/15-1) over varying timeframes, that's a bone-chilling performance chart we see above. One would have been better off simply ignoring the market and holding tight to their market basket. The financial results to your portfolio are the result of hitmen masquerading as easy-to-use, new-age hedging products.
Now in the next chart, below, we show the returns for the last 4 scenarios we previously noted (and we can see on the top of the first chart above that there are 2 orange, and 2 green scenarios.). The financial product that could have been used to express a view that volatility would fall are: XIV.
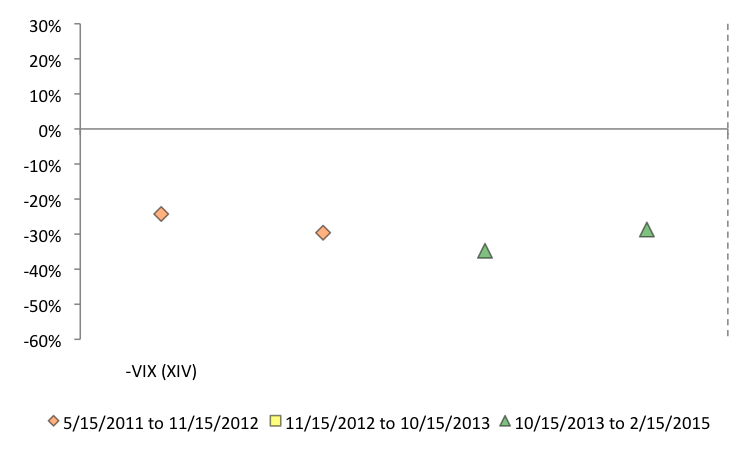
Again, despite volatility quickly falling greater than 21% (18/23-1) over varying timeframes, this strategy never benefited. In all 4 scenarios, the inverse VIX ETF, lost a lot of money. These annihilative results should make you think twice before taking on such products and tampering with market's general nature, in particular now as volatility last Friday again fell to a close below 15%. Recall that 12 of the 13 trades ended with significant loss (even though each were directionally correct) and some lost double-digit retuns in a matter of a few days. Even inappropriate investments from a Bulge Bracket broker's conviction list would give you better odds.
The top quants in the world have little relevant idea where volatility is headed. And certainly no one knows when and where the actual curves' tops or bottoms are. Don't get caught up in the craze and fool yourself into believing you can do better at trading then their "collective" wisdom. All options on the VIX futures, and other derivatives are priced smartly and do not provide you much difference in the expected results. You would be wise to tune out any financier alleging to explain such randomness as volatility itself, and offering to you worthless hints on how you (they) "can play it".
Copyright © Statistical Ideas