For this week's SIA Equity Leaders Weekly, we are going to revisit the broad U.S. Equity markets and a comparison versus Emerging Markets. U.S. Equity continues to be the highest ranked Equity asset class and even though there is strength in a few areas of Emerging Markets, overall the trend is clearly in favor of the U.S. at this time.
SPDR S&P 500 ETF vs. iShares MSCI Emerging Markets ETF (SPY vs. EEM)
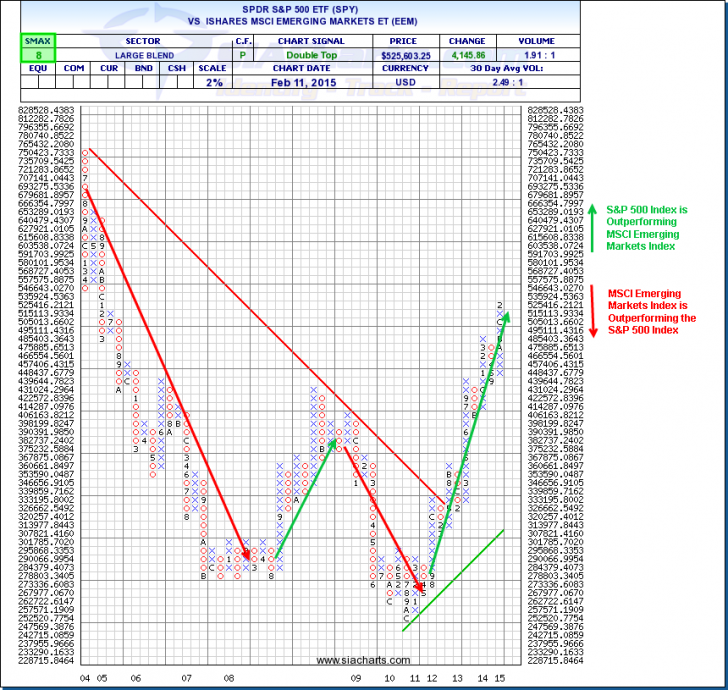
Looking at an important comparison chart between the U.S. Equity market versus the Emerging Equity markets shows very clearly where the relative strength is between these two areas. Emerging markets has had some long periods of outperformance from 2003 to 2008 and from 2009 to 2011, but since this time it has been all in favor of U.S. Equity. Breaking through a long-term trend line in May of 2012 has proved to be substantial change of direction between these two assets as the SPY has relatively outperformed by ~45% over this time period compared to EEM. This isn't to say that all of the Emerging markets are showing weakness as the strength at the top of this asset class that SIA has helped identify in India (where EPI is up ~42% in the last year and XID.TO up ~65% in CAD in the last year) or China have added alpha to advisor's portfolios, but overall that Emerging Markets are losing this relative strength relationship versus the U.S. Equity large cap space.
With the VS SMAX score of 8 strongly in favor of U.S. Equity at this time and with the long-term trend in favor of U.S. Equity as well, this trend in the past has lasted for long periods of time in favor of one equity market or the other and would look to continue in this direction until this relationship changes. With the strength of the US Dollar and other factors contributing to this outperformance as well, it is important to continue to monitor this relationship to help align yourself with key areas of strength.
Click on Image to Enlarge
S&P 500 Index (SPX.I)
The S&P 500 (SPX.I) has continued to move in an upwards direction having reached new all-time highs since we last looked at this chart in the middle of November. The resistance levels remain unchanged from the prior outlook with the first resistance level found at 2238.36 and above this at 2422.88 should the strength continue which can visually be seen in the chart by the colored green area.
To the downside, support is now found at 1910.42 and at 1836.24, which is the low from the last and only pullback over the last 2 years. Like in November, the S&P 500 Index is still showing a near-term strength SMAX score of 8 out of 10 and never gave a negative SMAX score during its short-term pull-back. To quote from October and November, "This near-term positive outlook could see the SPX.I move through to new all-time highs" and continues to be the same outlook going forward with both short and long-term relative strength over other asset classes.
Click on Image to Enlarge

SIACharts.com specifically represents that it does not give investment advice or advocate the purchase or sale of any security or investment. None of the information contained in this website or document constitutes an offer to sell or the solicitation of an offer to buy any security or other investment or an offer to provide investment services of any kind. Neither SIACharts.com (FundCharts Inc.) nor its third party content providers shall be liable for any errors, inaccuracies or delays in content, or for any actions taken in reliance thereon.
To learn more about how to utilize our system, how these U.S. Equity outlooks could affect your portfolio, or other key asset class outlooks, please call or email us at 1-877-668-1332 or siateam@siacharts.com.
Copyright © SIACharts.com