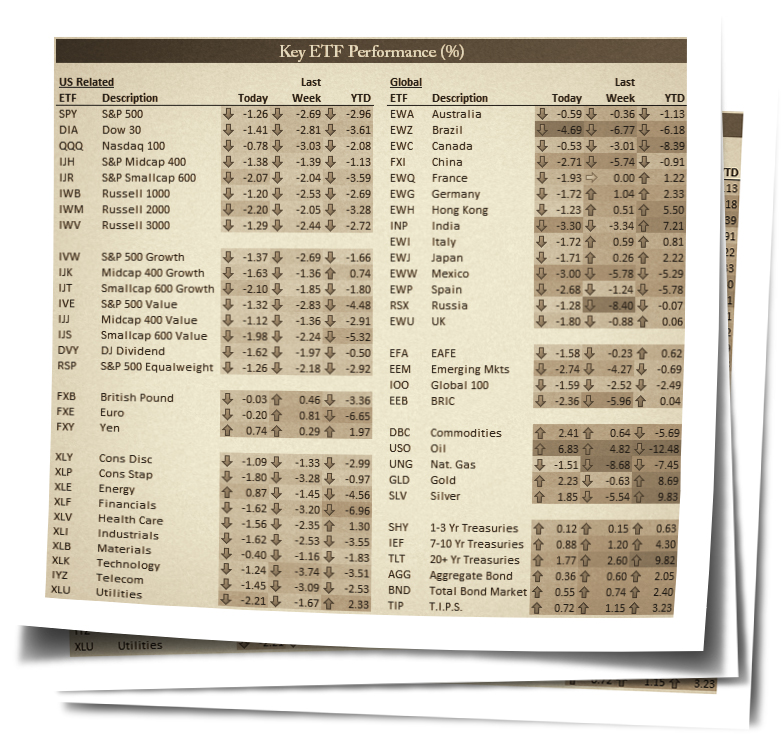
Markets really could have gone either way this afternoon, but they ended up taking a decidedly negative turn over the final 90 minutes of trading, and it left market bulls licking their wounds for the month of January. Below is a look at the performance of various asset classes in January using our key ETF matrix (which we draw from with our ETF Trends report over at Bespoke Premium).
The left side of the matrix contains mostly US-equity ETFs. As you can see, there's not a lot of green on the board. The S&P 500 SPY ETF finished the month down 2.96%, while the Dow (DIA) did even worse with a decline of 3.61%. In terms of sectors, Financials got crushed, falling 6.96%. Even Energy did better than Financials in January with a decline of 4.56%. While 8 of 10 sectors closed down on the month, we did see Health Care and Utilities finish in the green.
Returns were mixed in international markets. Brazil, Canada, Mexico and Spain were down 5%+ in January, but European markets like Germany and France both finished in the green. Asia did even better, with Japan, India and Hong Kong all gaining 2% or more.
Commodities were volatile in January. While oil bounced significantly today, it was still down 12.5% on the month. Natural Gas ended up falling 7.5% in January, but we saw gold and silver gain nearly 10% on the month.
Finally, Treasuries continued their epic run to start the year. As shown in the matrix, the 20+ year Treasury ETF (TLT) is already up 10% year-to-date. Simply unreal.
Sign up for a 5-day free trial to our Bespoke Premium service for a closer look at the weak start to the year and whether or not we'll see a turnaround in February.


