Commodities overall have continued to show weakness versus other asset classes. Everyone knows about the dramatic drop in Oil prices which we have covered closely throughout, but what is happening to some of the other major Commodity Futures? Even though some of the precious metals, like silver and gold, have seen an uptick to start the year, for this week's SIA Equity Leaders Weekly report, we will focus on two other Commodities in Copper and Natural Gas that have continued their downwards trends falling to multi-year lows.
High Grade Copper Continuous Contract (HG.F)
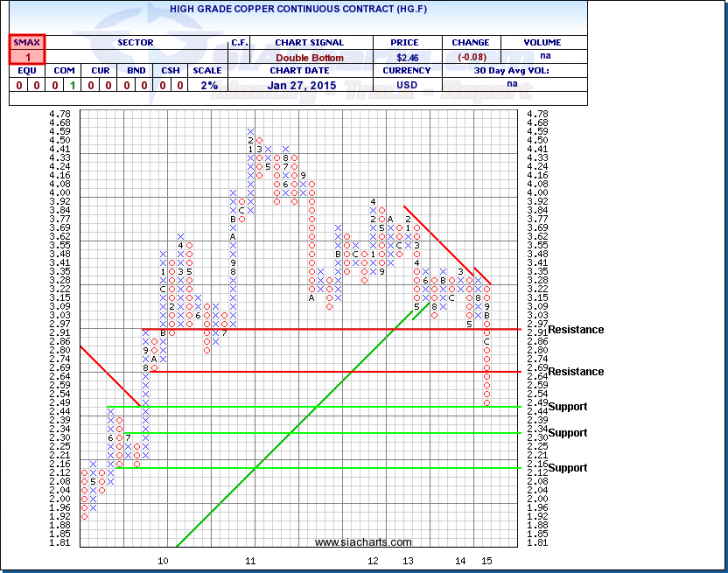
It has been a while since we last looked at Copper, but has experienced a downward trend since breaking through the upward long-term trend line. Having traded around the $3 range for much of May 2013 to May of 2014, since then it has fallen by more than 50 cents down to a minor support level at $2.44 currently. A move below this could see support at $2.30 and $2.12 come into play which Copper hasn't seen these low prices since the summer of 2009.
If Copper were to bounce off support, resistance above is found at $2.69 and around $3 above this. The SMAX score remains low at 1, showing near-term weakness against all asset classes.
Why is looking at the price of Copper important? Well, copper is used in so many industries and companies, especially construction projects, infrastructure, telecommunications, electronics and semi-conductors, medical, technology, mining companies, emerging markets, etc. So to help understand stocks or other investments you may look at buying, it is important to understand how the price of copper, oil, gold, currency, etc. could affect some companies more than others depending on their dependence on these price trends.
Click on Image to Enlarge
Natural Gas Continuous Contract (NG.F)
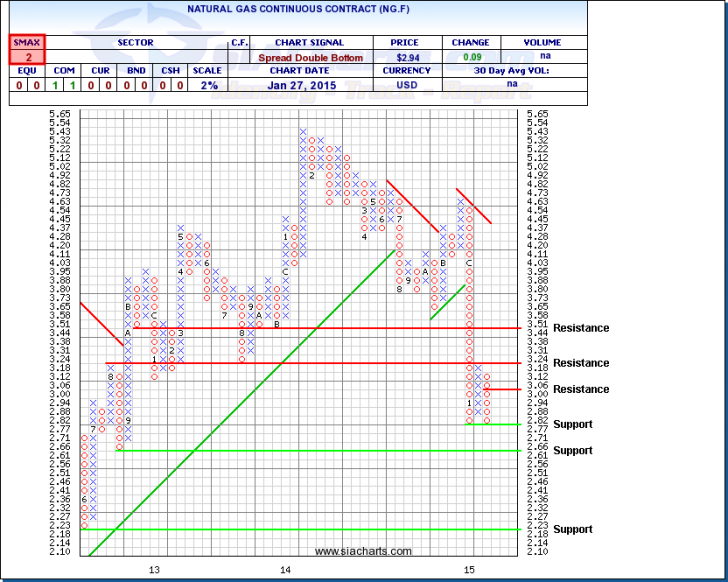
The ever volatile Natural Gas Continuous Contract (NG.F) has seen some very significant price slides over the past couple of months and has fallen around 40% since the high in late October. Higher than expected temperatures this winter, a fall in expected future rig count, and other factors have led to a change in the supply/demand relationship for Natural Gas. NG.F has now moved down to the first support level at $2.77, which represents a two-year low level. Below this is more support above $2.61 and at $2.18.
Should NG.F see a reversal, resistance above can be found at $3.06. Further resistance is found at $3.24 and at $3.51. With the SMAX score now at 2 out of 10, NG.F is showing near-term weakness against the other asset classes besides commodities.
To learn more about how to utilize our system, how these commodity outlooks could affect your portfolio, or other commodity outlooks, please call or email us at 1-877-668-1332 or siateam@siacharts.com.
Click on Image to Enlarge
SIACharts.com specifically represents that it does not give investment advice or advocate the purchase or sale of any security or investment. None of the information contained in this website or document constitutes an offer to sell or the solicitation of an offer to buy any security or other investment or an offer to provide investment services of any kind. Neither SIACharts.com (FundCharts Inc.) nor its third party content providers shall be liable for any errors, inaccuracies or delays in content, or for any actions taken in reliance thereon.
Copyright © SIACharts.com


