by Don Vialoux, EquityClock.com
Editor’s Note: Jon Vialoux is scheduled to appear on BNN’s Market Call Tonight tomorrow at 6:00 PM EST
Pre-opening Comments for Tuesday December 2nd
U.S. equity index futures were higher this morning. S&P 500 futures were up 3 points in pre-opening trade.
Bank of Montreal (BMO $83.29 Cdn.) is expected to open higher after announcing a $0.02 increase in its quarterly dividend to $0.80 per share
ITT Corp (ITT $40.02) is expected to open higher after Goldman Sachs upgraded the stock from Neutral to Buy. Target is $47.
Sprint Nextel added $0.03 to $4.90 after HSBC initiated coverage with an Outperform rating. Target is $6.30.
Stryker (SYK $92.96) is expected to open higher after Goldman Sachs upgraded the stock from Buy to Conviction Buy.
EquityClock’s Daily Market Comment
Following is a link:
http://www.equityclock.com/2014/12/02/stock-market-outlook-for-december-2-2014/
Interesting Charts
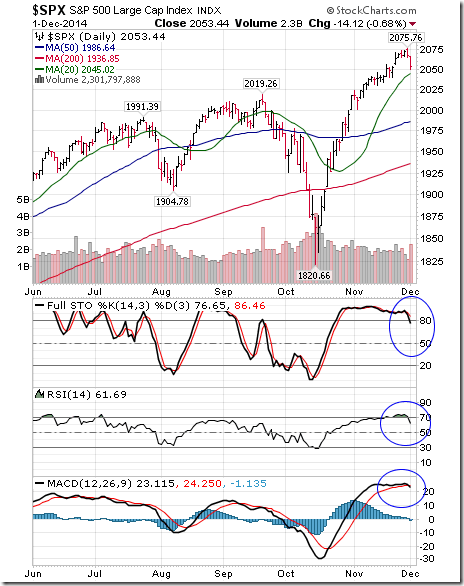
Short term momentum sell signals were recorded yesterday by the S&P 500 Index: Stochastics fell below 80%, RSI dropped below 70% and MACD recorded a negative crossover from an overbought level.
As noted in Jon’s Globe and Mail column on Friday, a shallow correction by the S&P 500 Index during the first two weeks in December frequently happens, triggered by yearend tax related transactions. The brief period of weakness usually provides a short term buying opportunity prior to the Santa Claus rally that lasts until at least the first week in January.
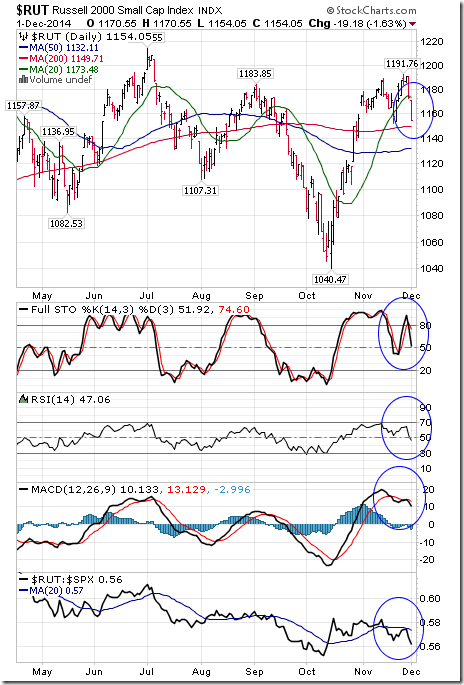
Other U.S. equity indices struggled more than the S&P 500 Index. In addition to showing a rollover by momentum indicators, the Russell 2000 Index is underperforming the S&P 500 Index and fell below its 20 day moving average.
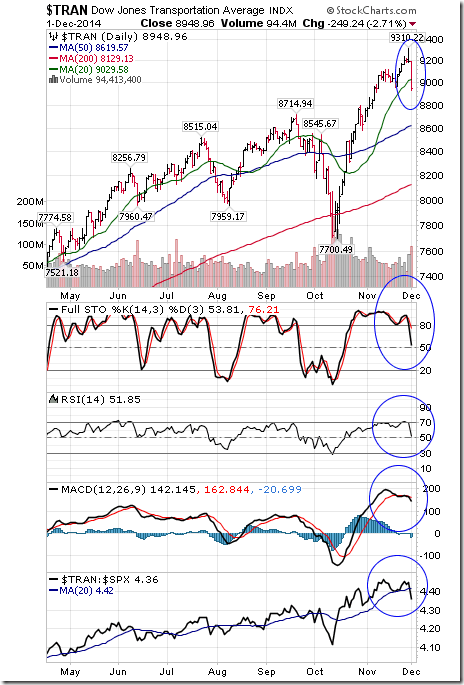
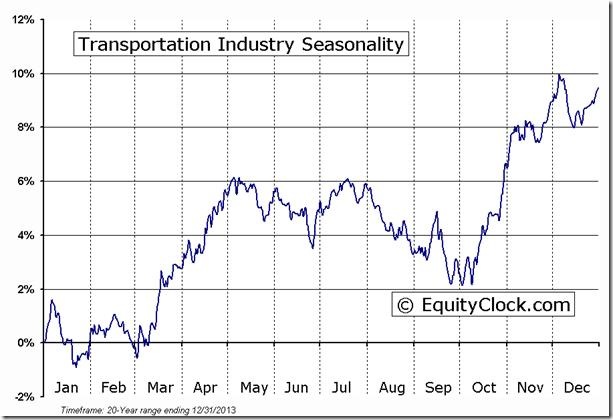
Ditto for the Dow Jones Transportation Average! ‘Tis the season to take trading profits in the Transportation sector!
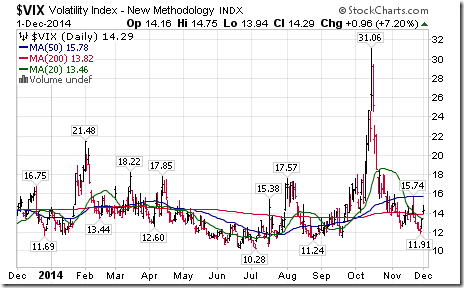
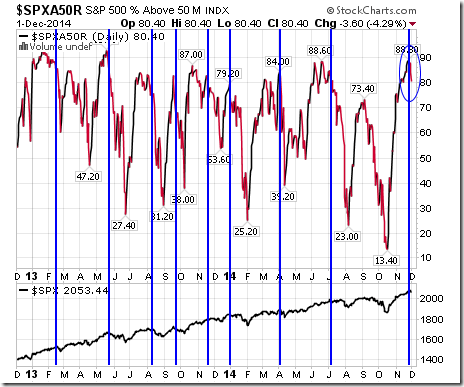
Other technical signs of a short term correction by U.S. equities included a spike in the VIX Index above its 20 and 200 day moving averages and a significant drop by the Percent of S&P 500 stocks trading above their 50 day moving average after exceeding the 80% level.
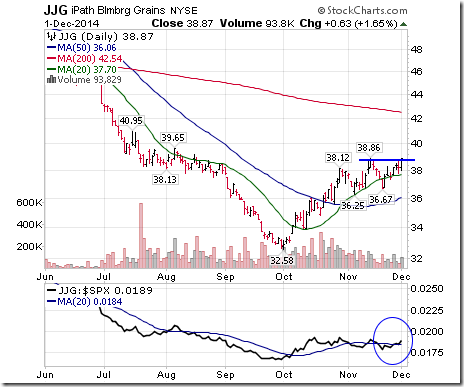
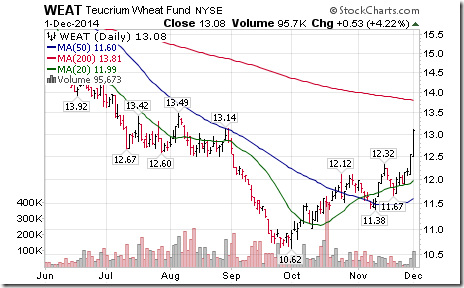
Grain prices continue to move higher, prompted mainly by additional strength in wheat.
StockTwit Released Yesterday @equityclock
Technical action by S&P 500 stocks to 10:15 AM: Slightly bearish. Breakouts: $AXP, $LLTC, $DE. Breakdowns: $BTU, $QEP, $EMR, $PWR, $ECL
Technical Action by Individual Equities Yesterday
Surprise! After 10:15 AM more S&P 500 stocks broke intermediate resistance than broke support. By the close 11 S&P 500 stocks broke resistance and 9 stocks broke support. However, breakouts were concentrated in one sector, utilities. S&P 500 utilities that broke resistance yesterday included CMS, ED, NU, PCG, SO, WEL and CTL.
Four TSX 60 stocks broke intermediate support levels: Suncor, Imperial Oil Enerplus and.SNC Lavalin.
Horizons/Tech Talk Weekly ETFs Market Sector Technical Score Card
Published before the market opened yesterday. Following is a link:
Monitored List of Technical/Seasonal Ideas
Green: Increased score
Red: Decreased score
A score of 1.5 or higher is needed to maintain a position
Note: SRCL, AAPL and FDX were removed from the list before the opening yesterday when they reached the end of their current period of seasonal strength.
Special Free Services available through www.equityclock.com
Equityclock.com is offering free access to a data base showing seasonal studies on individual stocks and sectors. The data base holds seasonality studies on over 1000 big and moderate cap securities and indices. To login, simply go to http://www.equityclock.com/charts/
Following is an example:
S5TRAN Index Relative to the S&P 500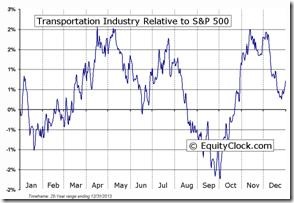 |
S5TRAN Index Relative to the Sector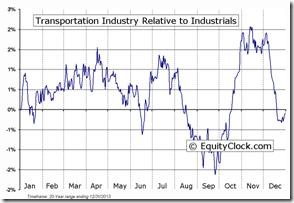 |
Disclaimer: Comments, charts and opinions offered in this report by www.timingthemarket.ca and www.equityclock.com are for information only. They should not be considered as advice to purchase or to sell mentioned securities. Data offered in this report is believed to be accurate, but is not guaranteed. Don and Jon Vialoux are Research Analysts with Horizons ETFs Management (Canada) Inc. All of the views expressed herein are the personal views of the authors and are not necessarily the views of Horizons ETFs Management (Canada) Inc., although any of the recommendations found herein may be reflected in positions or transactions in the various client portfolios managed by Horizons ETFs Management (Canada) Inc.
Individual equities mentioned in StockTwits are not held personally or in HAC.
Horizons Seasonal Rotation ETF HAC December 1st 2014
Copyright © Don Vialoux, EquityClock.com


