by Ben Carlson, A Wealth of Common Sense
It’s easy to lose sight of the longer-term movements in the stock market when we’re in the midst of such a strong bull market. As Charles Ellis once said, “The average long-term experience in investing is never surprising, but the short-term experience is always surprising.”
The problem is that investors have a difficult time defining what long-term means, to both their own situation and their market experience. Even decade-long periods can be vastly different depending on the investment cycle we’re in.
To show the changing nature of the market performance over different time frames, what follows are the updated rolling returns for three, five and ten years on the S&P 500. All returns are based on quarterly total return numbers going back to 1926 through the end of September 2014.
Here are the three year numbers:
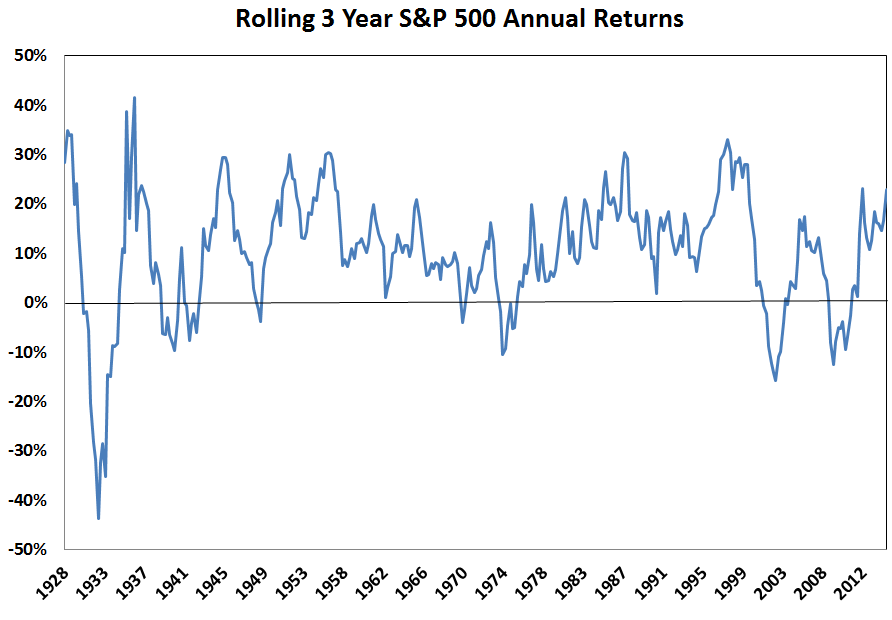
The latest three year annual return of nearly 23% is much higher than the average of around 10.4% per year.
Next are the five year numbers:
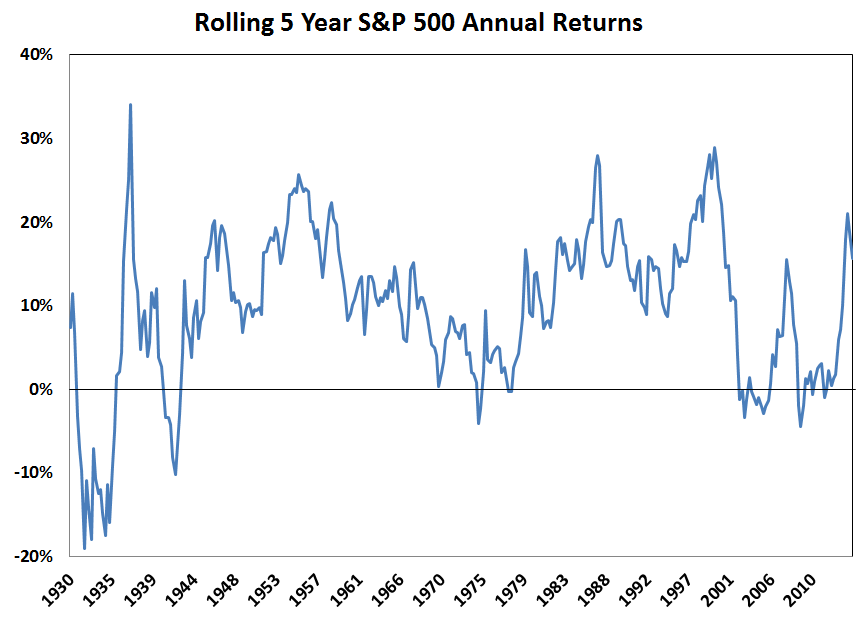
As of 9/30 the five year annual return was just shy of 15.7%. Again, this is much higher than the 9.8% long-term five year average.
Now for the ten year annual returns:
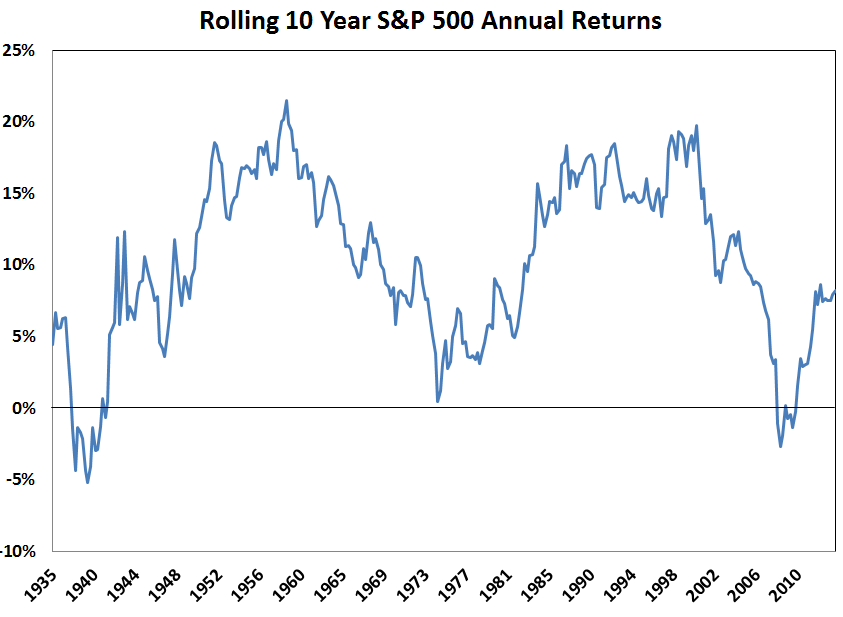
The most recent ten year number is actually below average — 8.2% vs. the average of 10.4% — which makes sense because it includes the financial crisis. Considering that this past decade of performance includes a drawdown of more than 55%, 8.2% annual returns actually aren’t that bad.
It also makes sense to view longer-term returns net of inflation to get a sense of the real returns. Here are the rolling ten year returns after inflation:

Because inflation has been so low over the past few years, the real returns are actually much closer to the long-term average than the nominal returns — 6.1% vs. the average of 6.7%.
It’s easy to look at any of these long-term averages and make conclusions based on where the the latest returns stand, but you have to remember that above average recent returns are front-loading future performance. For example, let’s say that the next five year real returns come in below average at 4% per year. In that case the ten year real returns in 2019 would still be almost 9% a year (well above average) because the past five years have been so great. Context matters, as always.
The most useful thing about these types of historical numbers is that they highlight that the fact that performance over any given time frame is in a constant state of flux. Actual returns are rarely anywhere near average returns.
Subscribe to receive email updates and my monthly newsletter by clicking here.
Follow me on Twitter: @awealthofcs
Copyright © Ben Carlson, A Wealth of Common Sense