by J.C. Parets, AllStar Charts
This week I was having drinks with a buddy of mine down in Miami who works at one of those discount brokerage advisor hybrid kind of shops. He normally deals with clients who we both agreed are typically on the exact wrong side of turning points in the market. They want to be in what has been working and they focus less on what could be or should be working going forward. I’m actually trying to aggregate this type of information as a sentiment gauge. The problem is these shops don’t want to give you the data and then you create an indicator based on their customers’ ignorance. It makes the company look bad. But I get it. That’s just business right? But I’m working on some things, don’t worry!
Anyway, my friend was telling me how a few of his contrarian indicator clients are fed up with having exposure in equities outside of the United States. Obviously the U.S. has been obnoxiously outperforming the rest of the world for some time now. While the S&P500 is up 13% year-to-date, the European equivalent Euro Stoxx 50 is actually down almost 4% during that same period. I can see why investors might be fed up with being positioned outside the U.S. But the fact that he’s getting calls to get them out in order to increase SPY exposure is telling in itself.
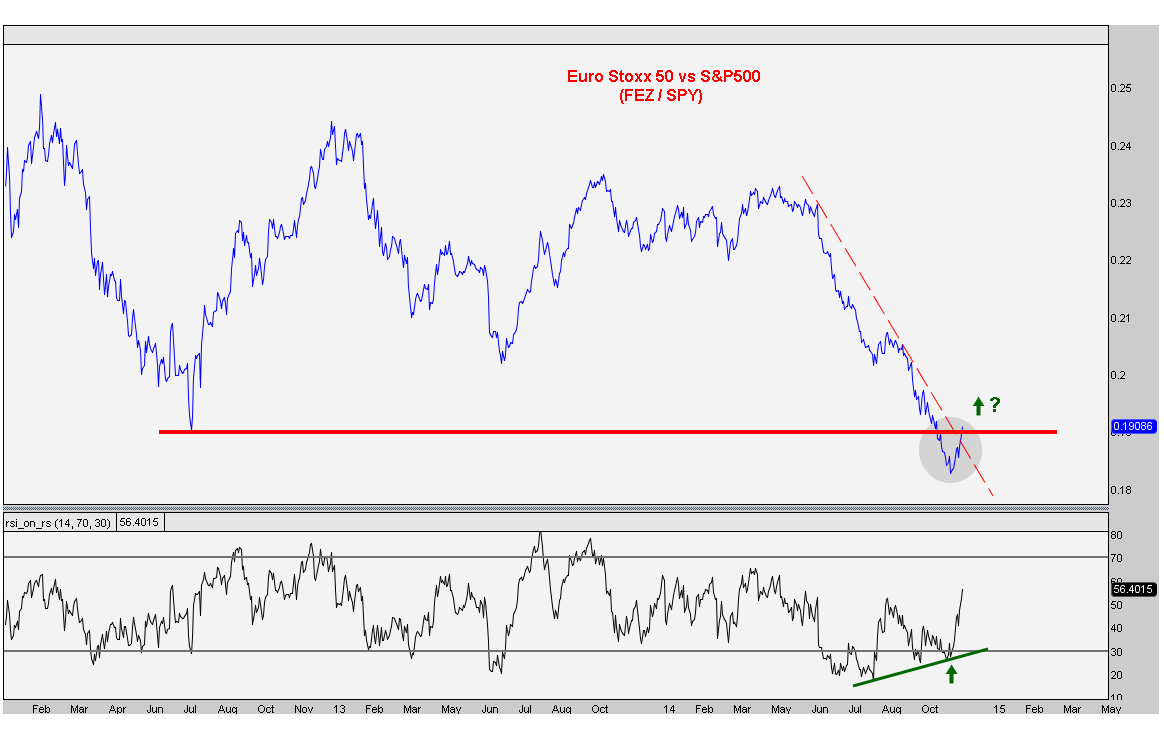
So here is a chart of the Euro Stoxx 50 relative to the S&P500, or the FEZ/SPY as we like to call it. What I like here is the potential failed breakdown below what were epic summer 2012 lows in this ratio. If you recall, this is when Greece was, “no longer going to be part of the Eurozone” and the Euro was being dubbed, “an experimental currency”. I kid you not. I remember this period like it was yesterday. In fact, I was writing about it extensively during that period in what I called at the time, “The Anatomy of My Favorite Trade”. There were some epic rallies that were sparked from that period including precious metals, euro and specifically European stocks. The Greek stock market, for example, more than doubled in a very short period of time off those lows. Barron’s nailed that bottom by telling us to short the Euro a week before it bottomed (see here). Love that!
Notice how momentum is putting in a nice bullish divergence on what is potentially a failed breakdown in this key ratio. Just when retail investors are fed up with too much exposure in Europe, I personally believe that right now is precisely the time to be rotating back in.
Meanwhile, there is historic bearish sentiment right now in the Euro itself. We look at the data and take it very seriously. We haven’t seen this much bearish sentiment since….well….summer 2012, just before the Euro exploded higher. So we know the dumb money wants out of European stocks. But what is the smart money doing? Well, we analyze the C.O.T. report every week and sure enough, we haven’t seen this kind of extreme lack of hedging take place in Euro since….well….summer 2012. The smart money was dead right then, and now that same group is telling us once again to get long and strong. Should we listen to the smart money? Or the retail community?
So what does Euro have to do with European stocks? I’ve been writing about them interchangeably throughout this post because their correlations are so high. Any time they’ve fallen, it’s only been for a brief period of time, and then the correlations spike positively right away. Currently the 26-week correlation coefficient between the Euro and the Euro Stoxx 50 is +0.86, meaning they move hand in hand.
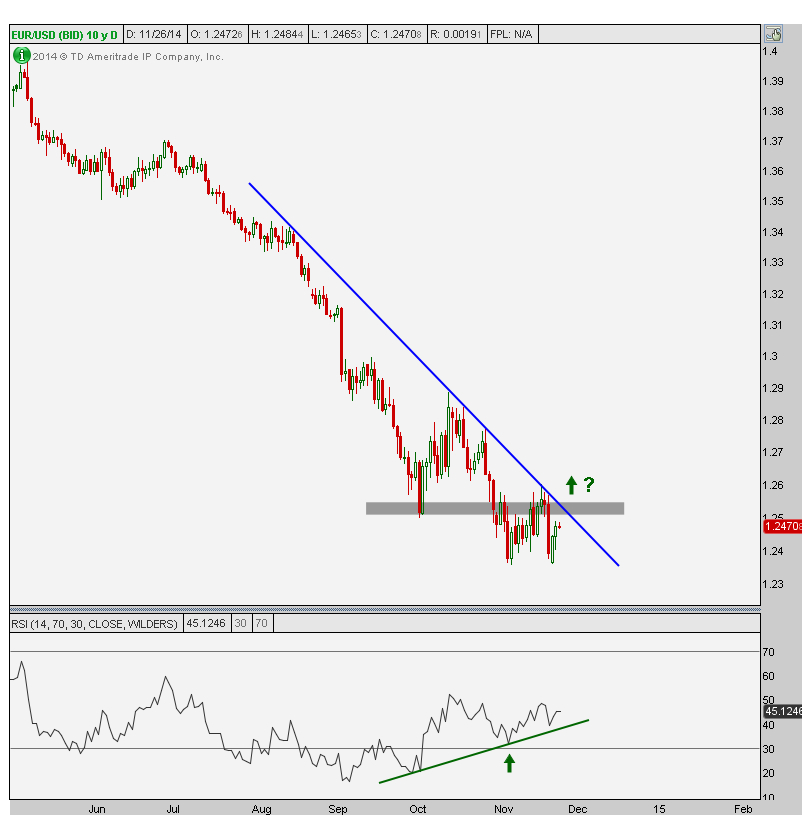
So what is the Euro currently doing just when there is a historic amount of bearish sentiment and the smart money thinks it goes higher? Well we’re seeing a nice bullish divergence in momentum and prices are flirting to break out above both a key downtrend line and former support from October to confirm a failed breakdown….
So what’s the execution? That’s the best part. In terms of the Europe vs USA stock ratio, we only want to be long above the 2012 lows. And in EURUSD? We only want to be long above both the early October lows as well as the downtrend line from those August highs. If we’re below either of those, then there is nothing to talk about. Above those and I think we get epic squeezes similar to what we saw in 2012. These are my favorite trades. Nothing makes me happier in the market than a good sentiment unwind. To me that’s the most fascinating part of my job. I can’t get enough of it.
But the best part here is how well the risk is defined. Usually the problem with certain positions or ideas is that risk is difficult to manage because the, “where am I wrong?”, question can’t be answered. In this case, not only do we know where we’re wrong, but we know exactly when we’d get involved as well. It’s a beautiful thing.
Members of Eagle Bay Solutions receive updates on these European charts on a weekly basis and know exactly what we’re thinking and why we’re doing what we’re doing. Check out our products page and find the one that is right for you. The Global Markets Package includes all of the European Stock Markets (within the weekly 86-page report with countries all over the world), while the Currencies and Commodities package includes all of the crosses against the Euro.
Full Disclosure: Nothing on this site should ever be considered to be advice, research or an invitation to buy or sell any securities, please see my Terms & Conditions page for a full disclaimer.
Copyright © AllStar Charts


