by David Templeton, Horan Capital Advisors
If there is one positive to the close of the month of September it is the fact investors can turn the page and set their sights on October and the fourth quarter. September has historically been the worst performing month in a calendar year and this is even truer when the prior month of August achieves returns greater than 3%. In fact, August of this year saw the S&P 500 Index return 3.8% and the Dow Jones Industrial Average return 3.2%. At the start of September, Ryan Detrick wrote an article, Welcome To September, The Worst Month Of Them All, where he looked at September return expectations under different time frames. Well, September 2014 did not go against the historical data.
As the below two charts show, developed and emerging market equity returns and fixed income returns were mostly negative for the month. The one index that generated positive returns for the month was the livestock index which was up 6.20%. Anyone buying beef/pork type products in the grocery store is well aware of higher beef and pork prices. With respect to equity returns, the safest segment was the large cap sector. Both the Dow and S&P 500 Index were down .23% and 1.40%, respectively in the month of September. The large cap returns were far better than the 4+% to 5+% losses in mid and small cap stocks. Even fixed income or bond returns struggled. Although not displayed below, the one fixed income segment that generated a barely positive return was S&P's National AMT-Free Muni Bond Index which was up .03% for the month of September.
 |
 |
From a sector perspective, energy, consumer discretionary, utilities and materials were poor performing market segments. The traditionally safe consumer staples were the best performing sector with a monthly return of .63%. This return was not even close to overcoming the -7.55% generated in the energy sector.
 |
In spite of the tough returns for the month of September and the third quarter, the year to date returns in the larger cap stocks remain healthy. As our clients know, at HORAN Capital Advisors, we have been overweight large cap stocks for three or so years. No one knows whether this recent market weakness will lead to the much awaited 10+% correction; however, the market technicals are not terrible as we noted with the chart in our post on Sunday. Certainly, market technical support needs to be found around S&P 1,950-1,960. These price levels represent the 100 day moving average and the 50% fibonacci retracement.
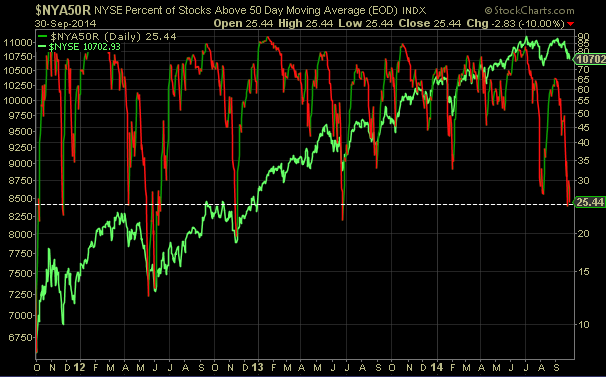
Also noteworthy is the near oversold levels for the percentage of NYSE Composite Index stocks trading above their 50 and 150 day moving averages. As the two charts below note, only 25% of NYSE stocks are trading above their 50 day moving average and 39% trading above their 150 day moving average. Certainly, lower percentages have been reached in the past before the market finds a bottom.
 |
 |
Lastly, historically the 4th quarter has been a positive returning one especially starting late in the second year of the presidential cycle. In an interesting article, The Set Up For A 4th Quarter Rally Is Missing Something, many factors are in place for a 4th quarter rally. One potentially missing ingredient though is the level of investor sentiment, i.e., we are missing the high bearish sentiment reading that has been a variable that has been present in past market bottoms. The just mentioned article is a worthwhile read.
 |
Source: The Fat Pitch
My sense is we may not be at the absolute bottom for this pullback. Potential issues facing investors are a stronger U.S. Dollar, the end of QE in October and the midterm elections in November. For the most part though, economic and company earnings reports are more positive than negative. However, many stocks are down much more than their respective indexes and they are providing an opportunity for investors to begin building positions in some of these stocks.
Copyright © Horan Capital Advisors


