J.C. Parets, AllStarCharts.com
The consistent underperformance out of the small-caps this year isn’t a secret to anyone at this point. But as we continue to break down to new multi-year lows relative to large-caps, I think it’s important to take a look at the action and put everything in perspective. What exactly happened to cause such a divergence between the two?
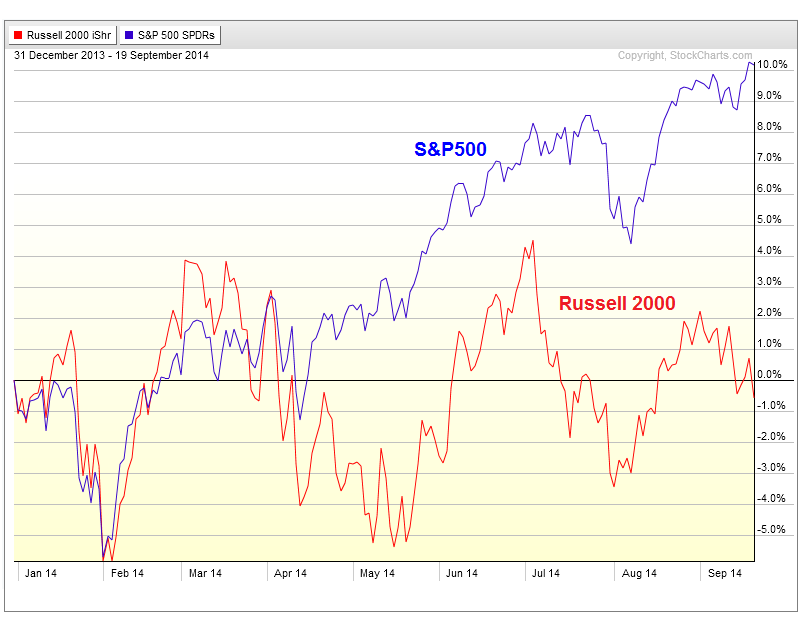
First of all, take a look at the small-cap Russell2000 year-to-date performance compared to that of the large-cap S&P500. With S&Ps up over 10%, the Russell2000 is actually down for the year. This unsustainable divergence is telling us that one of these is off. In all likelihood it’s the large-caps that will soon correct to catch up with the small-caps. When managers are nervous about the market, they tend to allocate assets towards the “safer”, less volatile large-cap names rather than overly speculate into the more volatile, “riskier”, small-cap space:

But the next chart is really the one that catches my attention as the small-caps hit multi-year lows this week relative to large-caps. Here is a ratio chart of the Russell2000 divided by the S&P500. That breakout to new all-time highs that failed miserably in March has led to quite the sell-off. Once again, from failed moves come fast ones in the opposite direction. We are now breaking the uptrend line from 2008 that has held so nicely throughout this entire bull market in US stocks over the last 5 years:
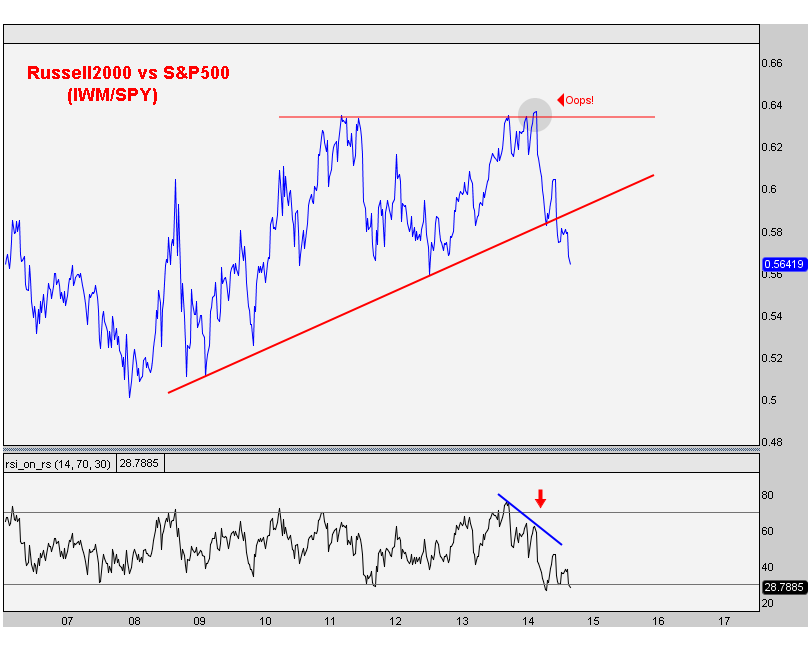
Also notice how momentum was putting in a bearish divergence at those new highs in March. RSI is now hitting oversold conditions which puts this momentum indicator in a bearish range. All signs are pointing to lower levels in this ratio and I see little reason to like Small-caps here, particularly on a relative basis.
Tags: $IWM $RUT $SPY $SPX $ES_F
Full Disclosure: Nothing on this site should ever be considered to be advice, research or an invitation to buy or sell any securities, please see my Terms & Conditions page for a full disclaimer.
Copyright © AllStarCharts.com