by Jesse Felder, The Felder Report
The most critical asset class in the world right now might just be the US bond market, as represented by the 10-year treasury note yield. So far this year bonds have performed very well as this rate has declined – foiling the best laid plans of all the bond bears (and there have been loads of them). But the bulls can’t quite plan their victory parade just yet because right now this critical interest rate is sitting at a critical technical level, a crossroads, actually.
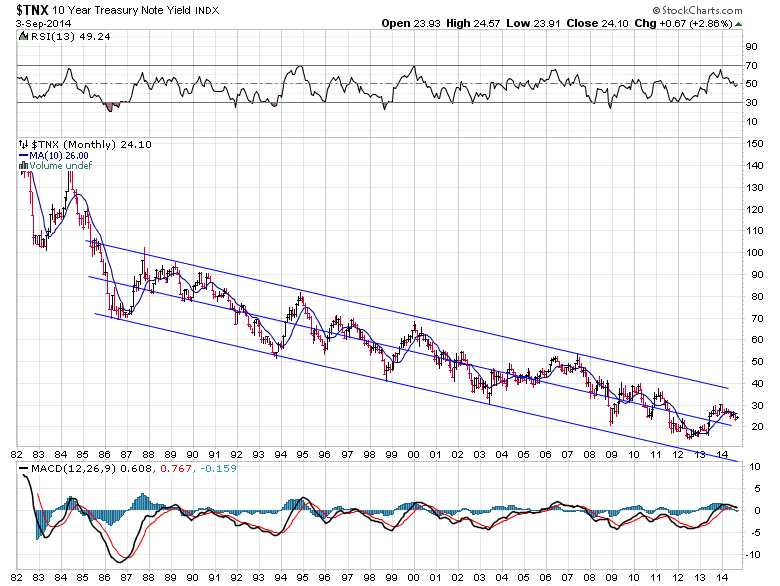
The downtrend for this rate is well-established. It might be the longest tenured trend, in fact, of any major asset class out there right now. Here’s a look a the monthly chart:
Clearly it’s not even close to breaking above that upper downtrend line that dates back to the mid-1980’s. So anyone making the case for higher interest rates is swimming upstream.
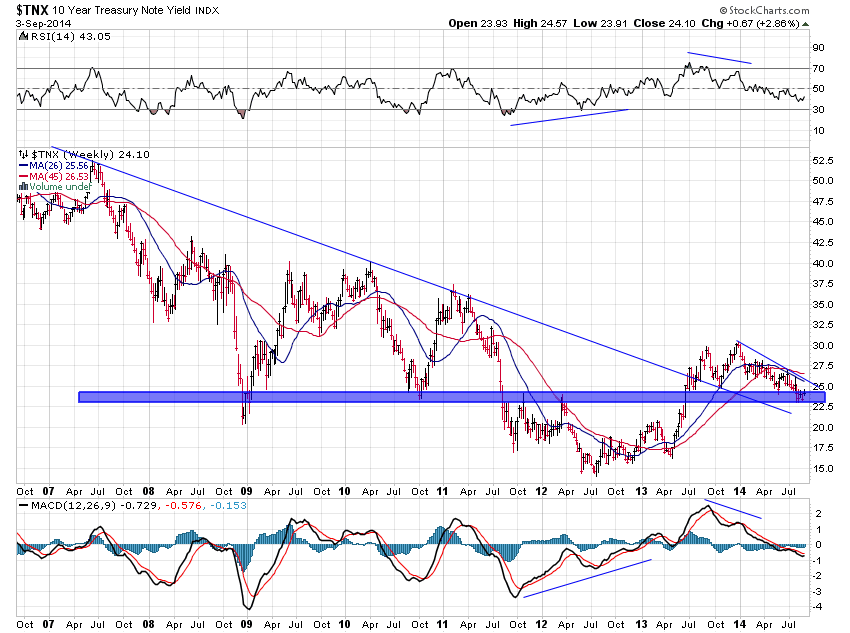
But take a look at the weekly chart and it’s a little bit different story:
After briefly breaching the 2.25% level during the height of the financial crisis and then testing it again in the fall of 2010 this rate finally broke down to new lows during the summer of 2011. It wallowed below that key level for a couple of years before regaining it during mid-2013 – along with breaking the downtrend line on that time frame – in a year that amounted to a walloping for long bond holders.
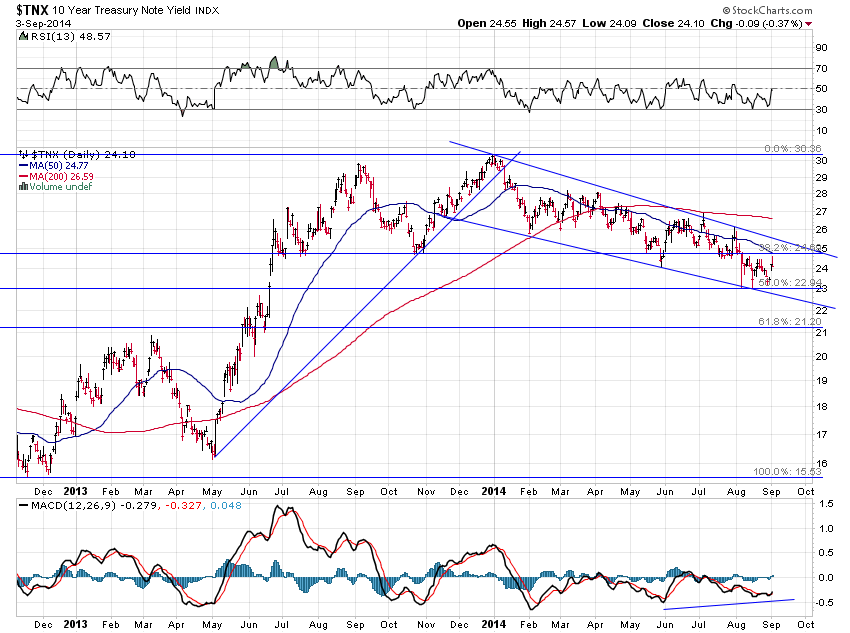
Much has been made of the weakness in rates/strength in bonds since then but, in actual fact, the action over the past few months has only amounted to a 50% retracement of the surge in rates from last year. And that area between 2.25% and 2.4% serves once again as key technical support. A closer look at a daily time frame shows what might be described as a bull flag (for the price action year-to-date) that has taken the rate right to the 50% retracement of the 2013 rise:
In any case the action this year has been corrective rather than implusive, as Elliott Wave aficionados would say, suggesting yet higher rates are in order. However, the trend is still pointing lower on all of these time frames so there’s something both bulls and bears can point to right now.
All in all, this 2.3%ish level serves as a technical line in the sand. Until it breaks meaningfully one way or the other bulls and bears are at a stalemate. Once it does break out, though, it could have major implications for both the stock market (in terms of relative valuations) and the economy (in terms of leading indicators).
Copyright © The Felder Report


