Separating Signal From Noise: What Does Sentiment Suggest for Future Returns
by Urban Carmel, The Fat Pitch
On July 24, SPY made its all time high. That same day, the number of AAII bulls in their weekly survey of retail investors was only 30%. In fact, this was a large drop from 45% bulls in mid-June and at nearly a 3 month low.
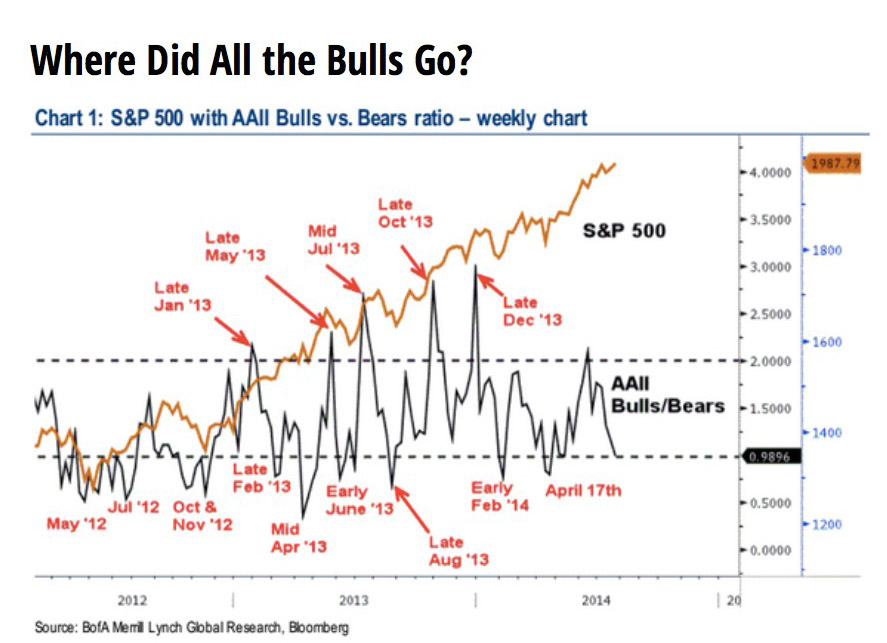
For many, this was a signal that further gains lay immediately ahead for equities. Markets don’t topple when so few are bullish, went the dominant line of reasoning. The chart below was posted on a popular blog at the same time. Note the author’s headline (click for a larger version).
SPY has since dropped 5%.
If sentiment suggested that investors were bearish and that stocks should rise, what went wrong? There were two things and both provide an important lesson for investors.
The first is the interpretation of AAII’s data. The sample size in the weekly AAII survey is small (about 100) and the actual respondents vary from week to week. In order to produce a useful signal, an extreme in bullish and/or bearish sentiment must be reached. 30% is within a normal distribution; it’s not an extreme and therefore not a signal.
As an example, below is a chart of AAII bulls over the past 25 years (lower panel) versus SPX . To make the chart readable, we have smoothed the survey numbers with a moving average. The normal range (+/- one standard deviation) is 29-49%. SPX has fallen over 7% when the number of bulls is anywhere within this range. In other words, 30% might sound like a low number of bulls but there is no signal at this level; it’s noise (click for a larger version).
Contrary to the popular meme, the last bull market did not peak on euphoria, at least not as measured by AAII’s survey. There were more bulls in 2006 than in 2007. Near the peak, less than 40% were bullish; a year earlier, the figure was near 60%.
This brings up a point we have made repeatedly about sentiment data: very often, the number of bulls declines ahead of a high in the market. To illustrate, below is a chart we posted in late January ahead of a 7% fall in SPY. The number of bulls is almost always lower into a peak. Remember this because this is one of the most durable BS memes around (chart from Bespoke; click for a larger version).
The second lesson from late July is the importance of confirmation.
At the all-time, AAII showed few bulls but this was an obvious outlier among data about investors’ views on the market. Investors Intelligence, NAAIM, put/call ratios, margin debt, Rydex and the BAML survey of fund managers all indicated that investors where not just bullish, but excessively so. This is not uncommon; there is typically contrary evidence in market data. Avoiding confirmation bias requires looking past outliers to what the majority of the data is indicating.
As an example, the chart below is from Investor Intelligence. On the week of the high in SPY, there were 3.3 times as many bulls as bears. By the way, this is an extreme greater than in either 2000 or 2007 (click for a larger version).
To make this data useful, below are some guidelines for interpreting the two most cited sentiment data.
From AAII’s own analysis, the data provides a signal when bulls or bears are outside of +/- one standard deviation from the mean. These are opportunities to go long with above average returns over the next 6 months. To simplify, our guideline would be to look for bulls under about 27% (click for a larger version).
For Investors Intelligence, an extreme in bearish sentiment has typically occurred when bulls minus bears is below 10%. This week, it was 33% (click for a larger version).
Charlie Bilello of Pension Partners has provided the historical returns for this data. In early July, bulls minus bears was over 40%; the returns over the next year are typically meager. In comparison, returns are above average when the difference is under 10% (click for a larger version).
For now, the dominant read on sentiment is that it is emerging from a period of excessive bullishness, after which returns are normally below average. Until a bearish extreme is reached, that should be investors’ bias based purely on sentiment. For us, sentiment is one of several indicators we track each week.
Copyright © The Fat Pitch


