
by Ben Carlson, A Wealth of Common Sense
“Beware of geeks bearing formulas.” – Warren Buffett
Research Affiliates puts out some of the most interesting and thought-provoking research in the investment industry. Founder Rob Arnott’s work on fundamental indexing is especially innovative.
The firm’s latest piece looks at smart beta and a host of factor investing data. One factor they looked into was the small cap anomaly. Past research has shown that small cap stocks have outperformed large cap stocks over longer time frames. Research Affiliates determined that this actually isn’t the case:
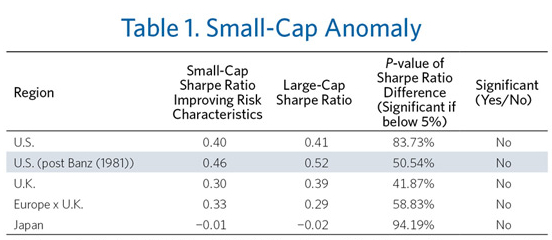
Using the Sharpe Ratio they showed that on a risk-adjusted basis there was no small cap anomaly. The research used here is interesting for data junkies, but it’s tough to say if it’s useful for investors when creating a portfolio.
It also begs the question about whether or not the Sharpe Ratio really makes sense as a way to gauge investment performance. More to the point — do risk-adjusted returns matter? Or should they matter to investors?
The Sharpe Ratio is a formula created by William Sharpe that compares returns per unit of risk by dividing excess performance over the risk free rate (cash or t-bills) by the investment’s volatility (standard deviation).
Take a look at this data on three different investments ranked by their Sharpe Ratios:
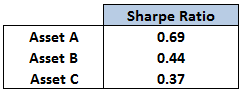
These results are based on the return history of actual mutual funds. Using risk-adjusted returns alone, you would choose Asset A in this case because it has the highest Sharpe Ratio.
Now here are the same three investments from the Sharpe Ratios listed above with actual performance numbers, volatility and the growth of investment dollars since 1993:
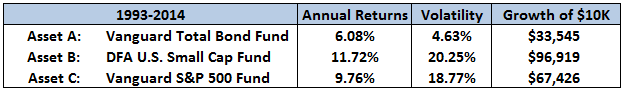
As you can see, basing an investment decision exclusively on the risk-adjusted returns could turn out to be problematic if volatility isn’t the only risk factor that matters for a given investment.
The only reason the Vanguard Total Bond Fund has the highest Sharpe Ratio is because fixed income funds have much lower volatility than equities. But that lower volatility comes with lower returns.
Although this data doesn’t go all the way back to the early 1980s the Sharpe Ratios are similar for large and small cap stocks. Yet the performance numbers and ending balances aren’t even close.
When comparing different asset classes or types of investments it’s difficult to see how the Sharpe Raio can be relevant to average investors. It would be hard to explain to an investor that they should be indifferent to large or small cap stocks based on the risk-adjusted returns over this 20+ year period when looking at the growth of a $10,000 investment.
Risk-adjusted returns are mainly used by academics and quant funds when comparing historical simulations. Certain strategies are able to create very low volatility returns using leverage so there has to be an understanding of the structure of the volatility as well.
It all depends on your definition of risk. Volatility isn’t a one way street. It works on both the downside and the upside as many investors that missed the huge rally have found out the hard way over the past five years. Investors really only care about downside volatility (aka losing money). Unfortunately it’s difficult to get upside volatility without downside volatility.
There are other ratios that capture losses only such as downside deviation or the upside/downside capture ratio. Luckily, investors aren’t forced to choose between asset classes based on risk-adjusted measures.
What really matters is how each investment is used within the framework of a total portfolio structure. Individual volatilities aren’t as important as how they’re paired together and what the returns are for the overall portfolio. This is why most investors use large caps, small caps and bonds together, regardless of their Sharpe Ratios.
There’s never going to be a single variable investors can use to choose between two or more securities, funds or asset classes. They’re all backward looking and tell us nothing about the future risk premium.
There’s no formula or ratio that’s going to be the ultimate determining factor that provides a yes or no answer. When formulas are used in this manner they only end up creating a false sense of precision. If only there was a way to measure future risks.
As with all forms of performance or risk measurement the best we can do is use them to consider potential or expected risks and rewards.
Source:
Finding smart beta in the factor zoo (Research Affiliates)
Copyright © A Wealth of Common Sense