For this week's SIA Equity Leaders Weekly, we are going to look back at both the 30-YR Interest Rate and also the Silver Continuous Contract as both of these charts have hit some interesting levels that we should be taking note of because of the possible further implications they may cause.
CBOE Interest Rate 30-YR (TYX.I)
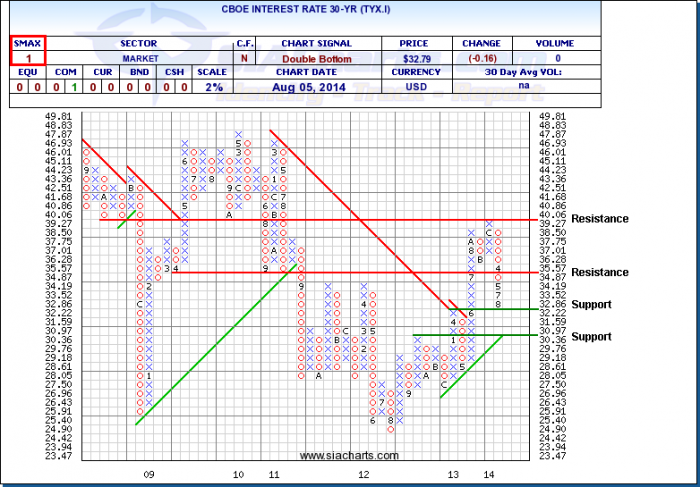
It's been over 3 months since we last looked at the TYX.I and since that time it has dropped another 4 boxes on the 2% chart down to its next support at 3.222%. With the SMAX now at 1, showing short-term weakness against all 5 asset classes, it is possible that we could see the next support level at 3.036% come into play, which also corresponds with the rising uptrend line.
This downward pressure could be signalling more of a move from Equities into Bonds, but as of right now we continue to see greater strength in Equities on a relative strength basis (for those interested you can look at a comparison chart of SIACEQ vs. SIABND).
Click on Image to Enlarge
Silver Futures Continuous Contract (SI.F)
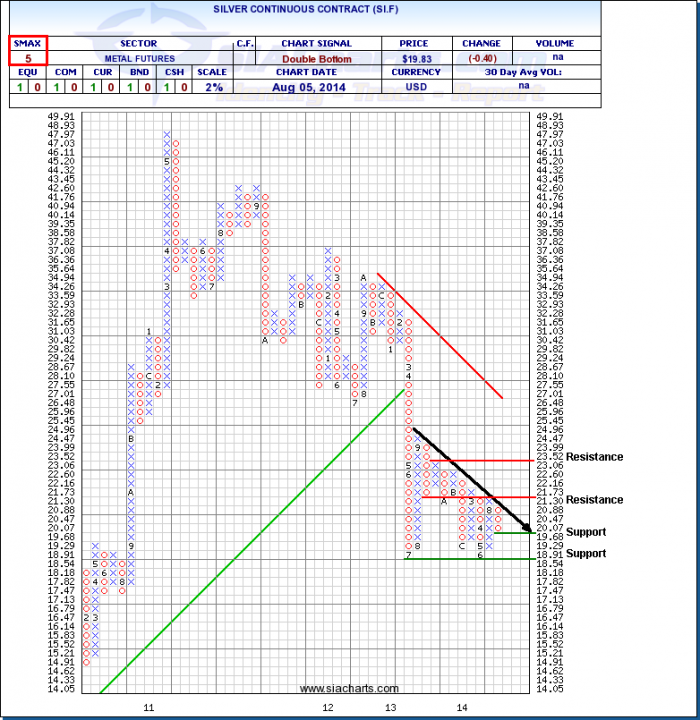
Looking at the chart of Silver, we can see that this is setting up in a classic descending triangle. The tendency for these types of charts are for them to break in the direction from where they started from, which in this case is downwards. This is by no means a guarantee, but for those of you who are in Silver or are interested in trading it, pay close attention to this chart, as when this type of pattern resolves itself it usually involves a substantial move. Consider the pattern to be like a spring which is coiling tighter and tighter until it finally breaks.
Support is found at $19.68 and again at $18.54, which also corresponds with the 3-year low. Resistance is at found at $21.73 and above that at $23.52. Since we last looked at Silver back in May, we have seen an improvement in the SMAX, but at 5, Silver is still showing short-term weakness against the asset classes.
Click on Image to Enlarge
SIACharts.com specifically represents that it does not give investment advice or advocate the purchase or sale of any security or investment. None of the information contained in this website or document constitutes an offer to sell or the solicitation of an offer to buy any security or other investment or an offer to provide investment services of any kind. Neither SIACharts.com (FundCharts Inc.) nor its third party content providers shall be liable for any errors, inaccuracies or delays in content, or for any actions taken in reliance thereon.
Copyright © SIACharts.com