by Don Vialoux, Timing the Market
Technical action plus concerns about an
escalating conflict in Ukraine contributed to weakness in
equity markets yesterday.
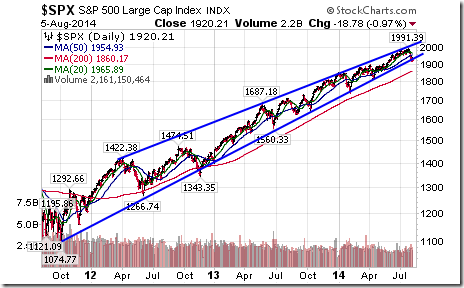
· The S&P 500 Index closed below 1,921, a long term
uptrend. The Index also completed a bearish rising wedge
pattern
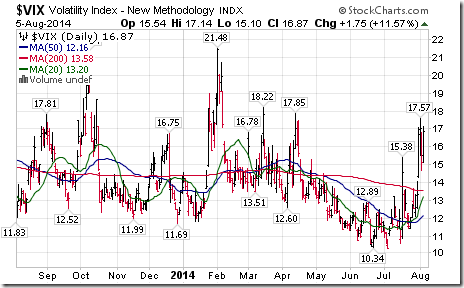
· The VIX Index spiked again. ‘Tis the season!
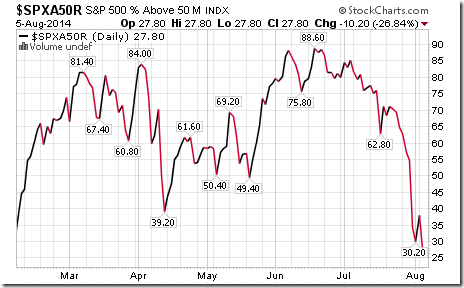
· Percent of S&P 500 stocks trading above their 50 day
moving average reached a new low. Percent already is
intermediate oversold, but has yet to show signs of bottoming.
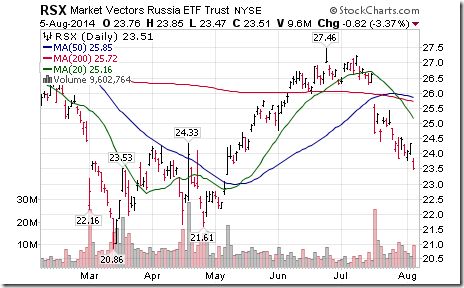
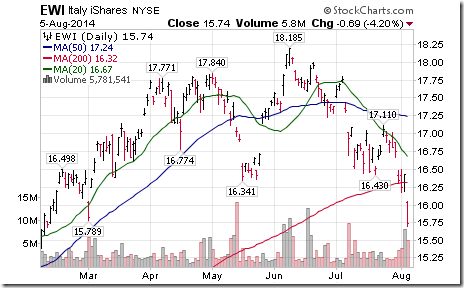
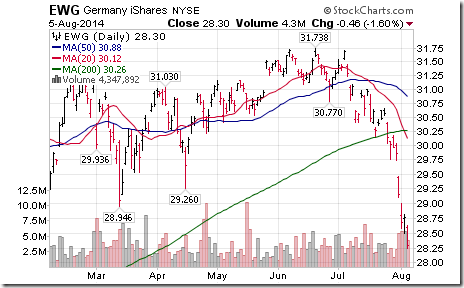
· European equity markets led world equity markets on the
downside. The Russian ETF already is down more than 14% from
its recent high.
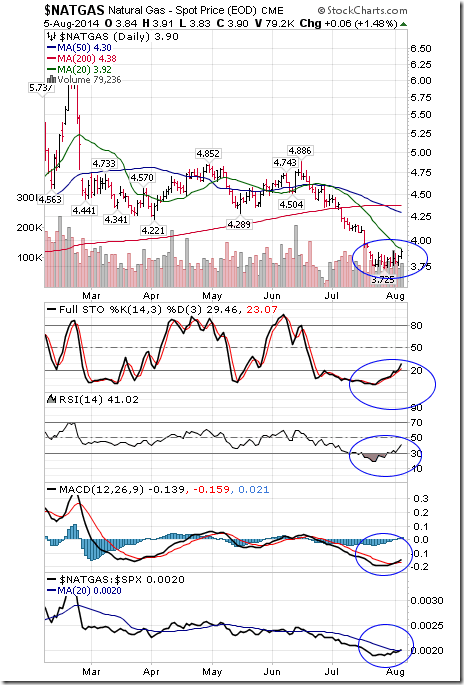
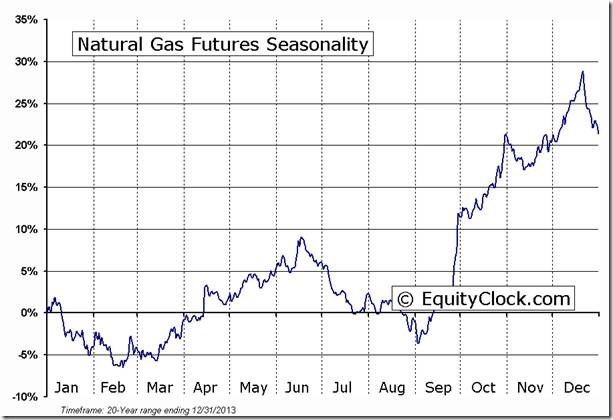
Natural gas is showing early signs of bottoming prior to start
of its period of seasonal strength at the end of August.
Hurricane season is approaching, a frequent trigger for higher
natural gas prices. It’s too early to make the call, but a
potential seasonal trade should be put on the radar screen.
Current technical positives include:
· A move above a three week trading range
· Short term momentum indicators (Stochastics, RSI, MACD) that
have bottomed and starting to roll up.
· Trades just below its 20 day moving average
· Strength relative to the S&P 500 Index has changed from
negative to at least neutral
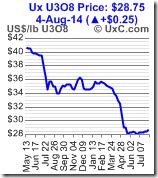
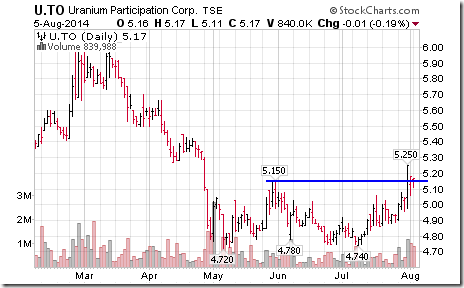
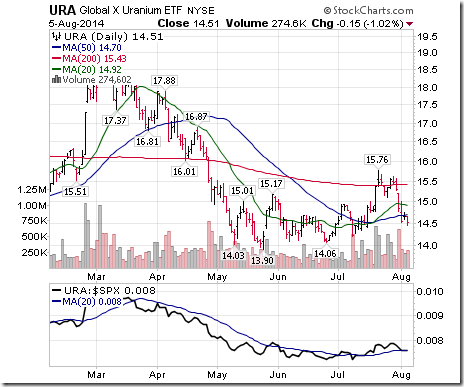
Spot Uranium Prices
Early signs that they have bottomed! They reached a four month
high when officially reported yesterday. Uranium stock prices
also have bottomed and have started to outperform the S&P
500 Index
Special Free Services available
through www.equityclock.com
Equityclock.com is offering free access to a data base showing
seasonal studies on individual stocks and sectors. The data
base holds seasonality studies on over 1000 big and moderate
cap securities and indices. To login, simply go to http://www.equityclock.com/charts/
Following is an example
FUTURE_NG1 Relative to the S&P 500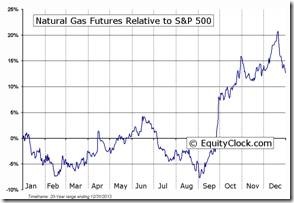 |
FUTURE_NG1 Relative to Gold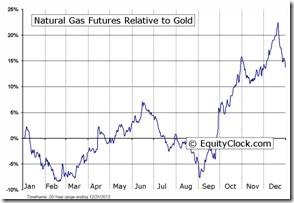 |
Horizons/Tech Talk Weekly Seasonal/Technical
Sector Review
Following is a link:
http://www.horizonsetfs.com/campaigns/TechnicalReport/index.html
StockTwits released yesterday
Available through twitter @equityclock
Charts have been updated to the close
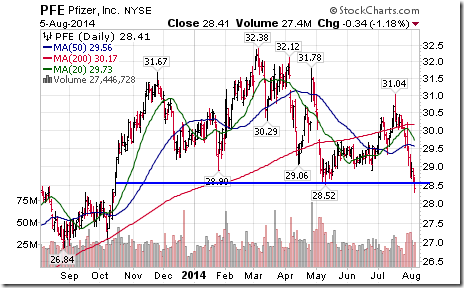
Quiet action in S&P stocks to 10:45. Three stocks broke
support: $AGN, $PFE, $DNB
Editor’s Note: Massive Head & Shoulders pattern!
Growing Ukraine concerns has prompted added S&P breakdowns
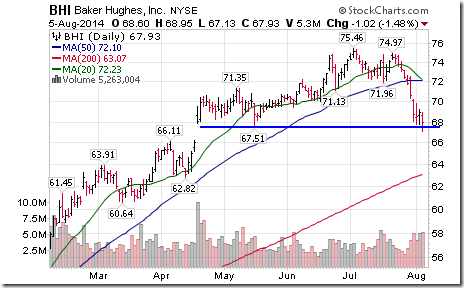
including $BHI, $KR and $VTR
Editor’s Note: BHI filling the gap?
Technical Action by Individual S&P 500
stocks
By the close yesterday, another 11 S&P 500 stocks had
broken support and none had broken resistance.
No TSX 60 stocks broke support or resistance yesterday.
Mark Leibovit Tutorial on the S&P 500
Index
Following is a link:
https://www.youtube.com/watch?v=tKG3x8fHJNo&feature=youtu.be
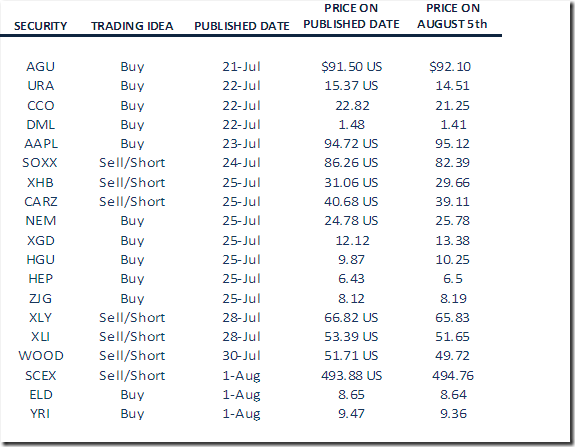
Monitored Technical/Seasonal Trade
Ideas
Disclaimer: Comments, charts and opinions
offered in this report by www.timingthemarket.ca
and www.equityclock.com
are for information only. They should not be
considered as advice to purchase or to sell mentioned
securities. Data offered in this report is believed to be
accurate, but is not guaranteed. Don and Jon Vialoux are
Research Analysts with Horizons ETFs Management (Canada) Inc.
All of the views expressed herein are the personal views of the
authors and are not necessarily the views of Horizons ETFs
Management (Canada) Inc., although any of the recommendations
found herein may be reflected in positions or transactions in
the various client portfolios managed by Horizons ETFs
Management (Canada) Inc.
Individual equities mentioned in StockTwits are not
held personally or in HAC.
Horizons Seasonal Rotation ETF HAC August
5th 2014
Copyright © Don Vialoux, Jon Vialoux, Brooke Thackray


