
 This fifth edition of Above the Market’s Leading Investment Indicators is for mid-year 2014 and the first since last July. Earlier iterations are here, here, here and here. As I always note, in economics, leading indicators are measures that typically change before the economy as a whole changes, thus providing some predictive power with respect to what lies ahead. For example, the Conference Board publishes a Leading Economic Index intended to forecast future economic activity.
My intent has been and still is to derive some Leading Investment Indicators. Unlike leading economic indicators, these were not designed as short-term or even intermediate-term predictors. The strength of these metrics is as a tool to measure potential real long-term returns. Thus they are better used as longer term indicators of value, risk and expected returns. They in no way should be used as any sort of timing mechanism. The stock market can continue higher or lower regardless of what any metric of valuation is showing. These indicators are designed to be a tool to help shape an overall investment thesis and process as well as to separate short-term and long-term concerns, not to dictate trading decisions.
My previous conclusions suggested that the market was not long-term cheap. I think they are worth re-visiting in light of recent events (or lack thereof) and as we pass the mid-point of 2014. But I won’t bury the lead (or even the lede). Stocks remain rich and the secular bear market continues (despite the long cyclical bull market rally, fueled by the Fed). Fed activity, as intended, makes stocks look much more attractive than they otherwise would — sort of like being the skinniest kid at fat camp.
As I have noted repeatedly, trying to fight the Fed hasn’t been a very productive approach over the recent past. If you’re going to play (and the risks of sitting things out are big too), please be careful and consider putting on a hedging strategy of some sort. So here goes….
1. PE10. The largest overall contributing factor to equity returns is the P/E ratio. The expansion or contraction of the broad market P/E ratio creates secular bull and bear markets. The chart below from Crestmont Research breaks down the components of total return for the S&P 500 for ten-year rolling periods. As of this writing, P/E is 19.71, well above the mean of 15.51, the median of 14.56 and last year’s level of 18.18..

Yale Professor Robert Shiller’s 10-year Average Inflation-Adjusted PE Ratio, also known as CAPE, Shiller PE or PE10, provides the best longer-term market gauge available. PE10 is the stock index price divided by the average real earnings from the previous 10 years – the time period is designed to smooth out near-term noise in the data. The basis for this approach is the finding that earnings valuation ratios provide predictive power for long-term stock market returns. Campbell & Shiller, “Valuation Ratios and the Long-Run Stock Market Outlook.” Journal of Portfolio Management 24, 2 (Winter 1998), pp. 11–26.
The long-term mean CAPE as calculated by multpl.com using Prof. Robert Shiller’s data is 16.54. In January 1921, PE10 was 5.12, the lowest value of any January in the historical period. Meanwhile, PE10 in January 2000 was 43.77, the highest January level in history. It is 26.48 today. well above the reading of 23.00 a year ago, suggesting that stocks remain significantly overvalued. Historical S&P 500 PE10 is charted below.

Source: multpl.com, using Prof. Shiller’s data
2. DY10. The dividend-price ratio or dividend yield (DY) is another predictor of the subsequent 10-year real returns on stocks, although this approach has its problems. Historical S&P 500 DY is charted below and also suggests that stocks are significantly overvalued today.
Source: multpl.com, using Prof. Shiller’s data
3. Tobin’s Q. The Tobin’s Q is the ratio of price to replacement cost, which is in many ways similar to book value. See Tobin & Brainard, “Asset Markets and the Cost of Capital,” Economic Progress, Private Values and Public Policy (1977). The most current Q ratio can be calculated from September’s release of the Flow of Funds report for Q2 2011. It is calculated by dividing line 35 of table B.102 by line 32. The historical data is also available on the St. Louis FRED website. However, because the Flow of Funds report is released long after the quarter end, getting a relatively current level takes a bit of extrapolation.
When equity as a percentage of GNP is above-average then total real returns for U.S. equities have a high probability of being below average. When equity as a percentage of GNP is below-average then total real returns for U.S. equities have a high probability of being above-average. Another use for Q is to determine the valuation of the whole market in ratio to the aggregate corporate assets. The Q ratio is a statistical measurement of the market’s value; fair value for Q is 0.65, primarily because capital stock is routinely overstated leading to a larger denominator in the Q equation. See Smithers & Wright, Valuing Wall Street : Protecting Wealth in Turbulent Markets and Doug Short’s excellent analysis here).
Per Doug, the average (arithmetic mean) Q Ratio is about 0.68. The all-time Q Ratio high at the peak of the Tech Bubble was 1.78 — which suggests that the market price was 153 percent above the historic average of replacement cost. The all-time lows in 1921, 1932 and 1982 were around 0.30, which is about 57 percent below replacement cost. Based on the latest Flow of Funds data, the Q Ratio through the end of the second quarter of 2014 was 1.15, up from the 1.05 level I noted a year ago. Doug’s current estimate puts the ratio about 70 percent above its arithmetic mean and 83 percent above its geometric mean, a good bit higher than when we last checked in. By this measure too, then, the market remains overvalued.
4. Market Cap to GDP. Market Capitalization to GDP has been described by Warren Buffet as “probably the best single measure of where valuations stand at any given moment.” It compares the total price of all publicly traded companies to GDP. This metric can also be thought of as an economy wide price to sales ratio. The data here is from the St. Louis FRED. However, because the data is quarterly, data for the other months have been entered using the prior ratio adjusted for the change in stock prices. As charted below, this metric suggests that stocks are significantly overvalued and overvalued as compared to previous editions of this post in October, 2011, August, 2012, January, 2013 and June 2013 (.96, 1.01, 1.03 and 1.17 compared to the current 1.27).

Source: Vector Grader
5. Bond Yields. Returns on bonds depend on the initial bond yield and on subsequent yield changes. Low bond yields tend to translate into lower returns because of less income and heightened interest-rate risk. As Warren Buffett has pointed out (although he is not alone in this), “interest rates act as gravity behaves in the physical world. At all times, in all markets, in all parts of the world, the tiniest change in rates changes the value of every financial asset. …If interest rates are, say, 13 percent, the present value of a dollar that you’re going to receive in the future from an investment is not nearly as high as the present value of a dollar if rates are 4 percent.” As charted below, despite recent volatility and pressure, long-term interest rates have been generally declining for more than 30 years and remain near record low levels, despite routine calls for a “bond bubble” over the past several years, suggesting that all assets are at risk going forward.
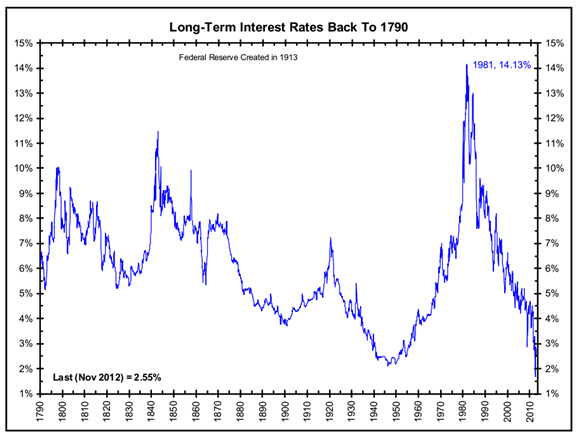
Source: The Big Picture (for a more limited period, the U.S. Treasury data is available for charting here)
These measures all confirm that, from a longer-term perspective, the market remains overvalued and, if anything, somewhat more overvalued than it was when I last ran these numbers a year ago. As I have been saying for a long time (for example, here, here and especially here) – we are (since 2000) in the throes of a secular bear market, subject to strong cyclical swings in either direction. I continue to encourage investors to be skeptical, cautious, and defensive yet opportunistic. I suggest that they look to take advantage of the opportunities that present themselves while carefully managing and mitigating risk, which should remain their top priority.
Copyright © Above the Market