


Over the past 30 years, the investment industry has been defined by the principles of Modern Portfolio Theory and the Buy & Hold Model. The 18 year period from 1982-2000 saw the strongest Secular Bull Market on record, which seemed to validate the effectiveness of these models. However, the Secular Bear Market of the last 14 years has revealed the significant limitations of these models and the need for a more robust and adaptable Investment Paradigm. The best way to analyze any system is to examine the foundation upon which it is built. Your foundation will determine your outcome! So let’s compare the foundations of Modern Portfolio Theory and Relative Strength to determine the best way forward.
Modern Portfolio Theory – The Efficient Frontier
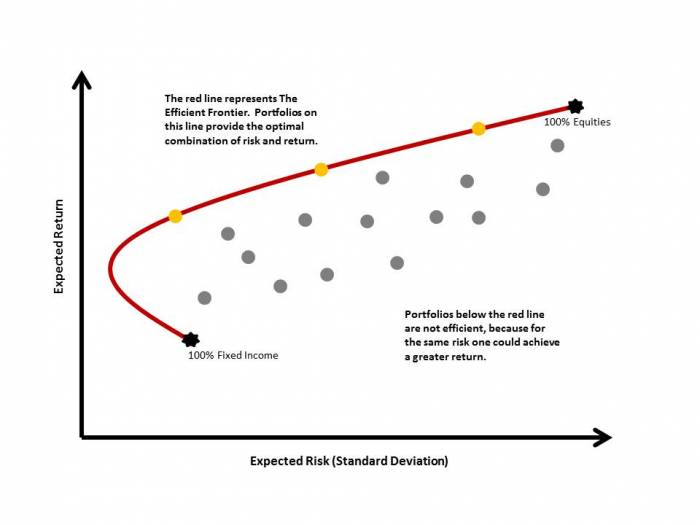
The cornerstone of Modern Portfolio Theory (MPT) is The Efficient Frontier, which describes a set of optimal portfolios that offers the highest expected return for a defined level of risk or the lowest risk for a given level of expected return. Let’s analyze the foundation of this approach by examining the opening paragraph of Harry Markowitz’s (MPT founder) Portfolio Selection publication in the Journal of Finance in 1952, which was his introduction of MPT to the world. He states: “The process of selecting a portfolio may be divided into two stages. The first stage starts with observation and experience and ends with beliefs about the future performances of available securities. The second stage starts with the relevant beliefs about future performances and ends with the choice of portfolio. This paper is concerned with the second stage”. (emphasis added)
What does this mean? The first stage refers to developing your future assumptions about the risk, return and correlations of your investment universe. This is up to the individual to develop these inputs. Then the second stage takes these inputs and runs them through the mean-variance optimizer to develop their efficient frontier and portfolio weightings. MPT only deals with the second stage! Therefore the challenge is to first input the correct assumptions into the optimizer to produce an effective result. As the saying goes, “Garbage in, garbage out!”. Since nobody has a crystal ball on the future, the inputs are very subjective, but the results are completely dependent upon the accuracy of these subjective inputs!
So the very foundation of utilizing MPT as a portfolio management strategy is built upon very subjective inputs, specifically your ability to develop accurate assumptions about the future return metrics of your investment universe! In our opinion, this lack of understanding has been one of the primary reasons for the frustration and disappointment in investors’ performance over the past decade using this model.
Click on Image to Enlarge
Relative Strength Methodology
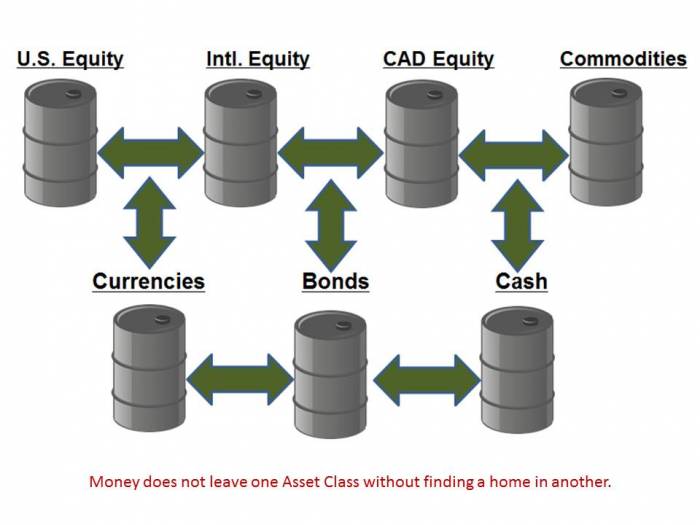
Relative Strength as it is utilized by SIACharts is rooted in an understanding of what ultimately drives the markets, namely supply and demand. This is the first principle of investing and the very foundation of how the markets operate. The markets are driven by one factor above all else, and that is money flows. Money or capital is constantly moving from one area of the market to another and always finds a home somewhere within the marketplace. This flow of capital is what creates an imbalance in the supply/demand relationship of any investment. And if demand outstrips supply, the price of that investment will go up, if supply outstrips demand the price will go down. This movement of capital around the market is what creates long term trends within individual investments or sectors, bull and bear market cycles for the broader asset classes and affects the risk/reward characteristics of every investment. Relative Strength seeks to identify the strongest or weakest areas within the market by comparing the price action of one investment vs all others. Remember, price action is driven by its supply/demand relationship which is ultimately driven by money flows. In order for one investment to show stronger relative strength vs another, by definition it has to have a more favourable supply/demand relationship and therefore stronger inflows of money. This enables us to align ourselves with the market rather than fight against it because whatever approach an investor uses to analyze the markets, whether Fundamental Analysis, Technical Analysis or Behavioural Finance, at some point all of this analysis will have to be filtered through the supply/demand relationship as investors act upon their beliefs. We only care about what the supply/demand relationship is indicating because it is the only metric that has a direct correlation to price action. In doing so, we reduce the subjectivity inherent in MPT and focus our attention on objective money flows.
Your foundation will determine your outcome! If your current investment approach is not working, it may be time to re-examine your foundation!
Click on Image to Enlarge
SIACharts.com specifically represents that it does not give investment advice or advocate the purchase or sale of any security or investment. None of the information contained in this website or document constitutes an offer to sell or the solicitation of an offer to buy any security or other investment or an offer to provide investment services of any kind. Neither SIACharts.com (FundCharts Inc.) nor its third party content providers shall be liable for any errors, inaccuracies or delays in content, or for any actions taken in reliance thereon.
Call or email us to request this article in PDF format at 1-877-668-1332 or siateam@siacharts.com.
Copyright © SIACharts.com