Since we last looked at these two commodities a couple of months ago, both of these Commodity Futures have reversed their course: one to the upside and one to the downside. For this weeks SIA Equity Leaders Weekly, we are going to look back in on both Copper and Silver and see how each have fared recently.
High Grade Copper Continuous Contract (HG.F)
Copper has recently seen a positive bounce off the support level at $2.91, and has now moved up to its first resistance level at $3.22. There is continued resistance immediately following at $3.28 with the declining trendline and then again at $3.41, which is the high that has held 3 times over the last year.
We have also seen a slight increase in the SMAX at 2, but that still remains very weak against the 5 asset classes. With significant resistance levels above, these levels will be important to keep an eye on to see if Copper can improve its long-term outlook or revert back down below $3 again.
Click on Image to Enlarge

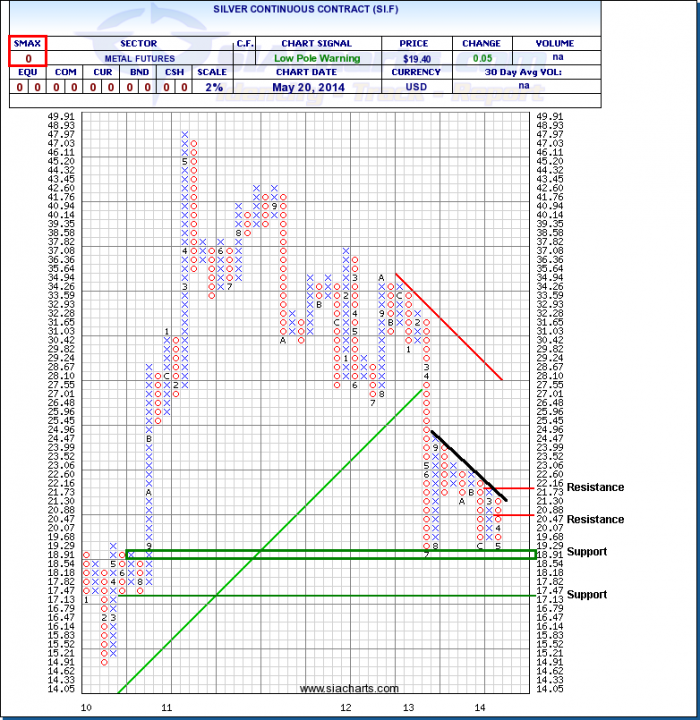
Silver Continuous Contract (SI.F)
Unlike Copper above, Silver has seen a downturn over the past 2 months, bouncing off the declining trendline we have drawn in. This move was weak enough to have Silver now re-chaIlenging the general support area from the last year between $18.50 and $19. Further weakness could see the support level at $17.13 come in to play, a level last seen back in 2010. Overhead, resistance is at $20.88 and again at $22.16.
Overall we continue to see weakness in Commodities as this asset class still sits in the 5th spot in the SIACharts Asset Class Rankings, and the SIA Metals and Mining Sector is down 2.18% YTD while the TSX Composite Index is up 6.63%.
Click on Image to Enlarge
SIACharts.com specifically represents that it does not give investment advice or advocate the purchase or sale of any security or investment. None of the information contained in this website or document constitutes an offer to sell or the solicitation of an offer to buy any security or other investment or an offer to provide investment services of any kind. Neither SIACharts.com (FundCharts Inc.) nor its third party content providers shall be liable for any errors, inaccuracies or delays in content, or for any actions taken in reliance thereon.
Feel free to contact the SIA Team at siateam@siacharts.com or 1-877-668-1332 if you would like more information on this analysis.
Copyright © SIACharts.com