by Don Vialoux, Timing the Market
Interesting Charts
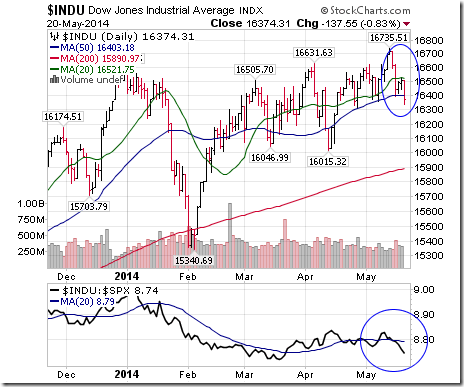
More downside technical action by broadly based U.S. equity indices! The Dow Jones Industrial Average closed below its 50 day moving average. Strength relative to the S&P 500 Index has turned negative.
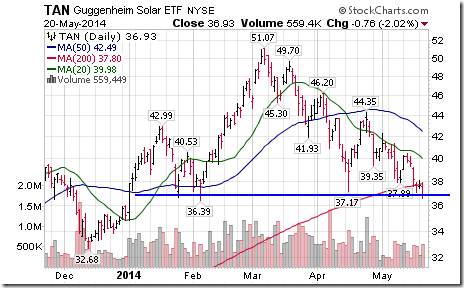
Solar stocks and their related ETFs remain under technical pressure.
Horizons ETFs Market Sector Technical Score Card
Following is a link to the report released yesterday:
http://www.horizonsetfs.com/campaigns/TechnicalReport/index.html
A Summer Rally?
MarketWatch.com released a column yesterday entitled, “Don’t bet on a summer rally this or any other year”. Following is a link to the column:
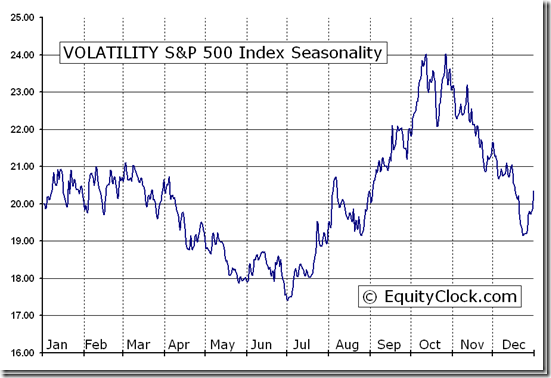
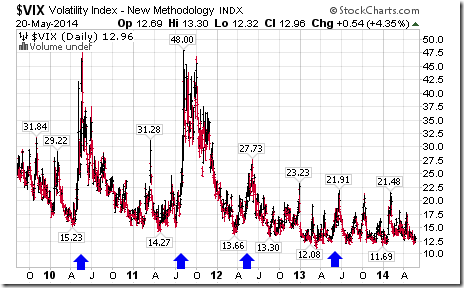
The column confirms previous comments by Tech Talk that a summer rally statistically is a myth. The more accurate expectation is for a summer swoon when equity markets on both sides of the border record a correction accompanied by a spike in volatility. Following is a chart on the VIX Index showing that volatility in equity markets moves higher in summer usually because of unexpected political, economic, international or weather-related events. If something in the world goes wrong, it usually happens in the May to October period. Sweet spot is from the beginning of July to the middle of October.
VOLATILITY S&P 500 Index (^VIX) Seasonal Chart
What about this year? So far, VIX is low and has yet to show signs of spiking. Stay tuned!
Stock Tweets Yesterday
(Price charts have been added)
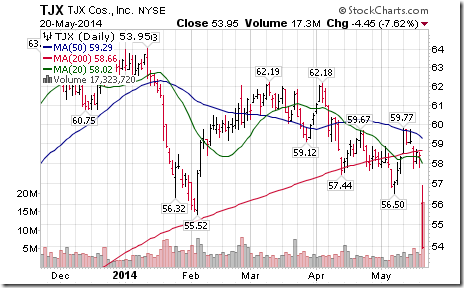
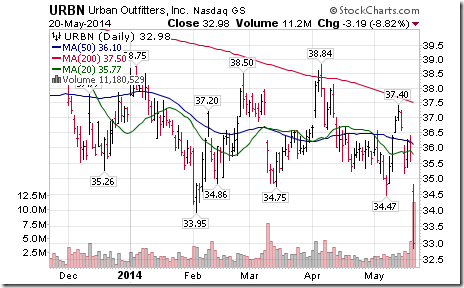
Retail stocks were notably under pressure this morning on lower than expected Q1 sales. Breakdowns included $ROST, $TGT, $TJX, $URBN
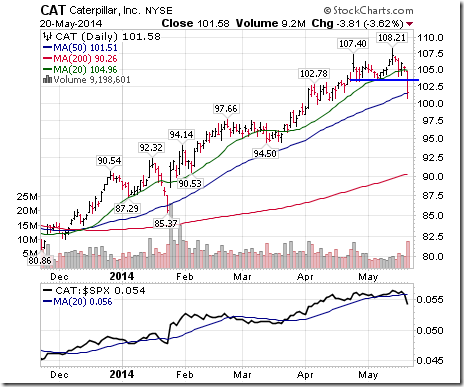
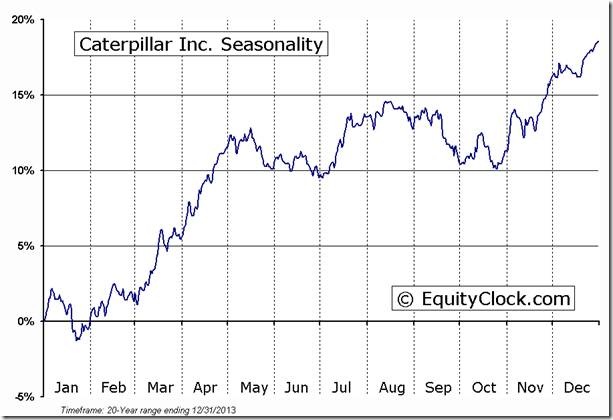
$CAT broke support this morning at 103.43. Seasonal influences peak at this time of year.
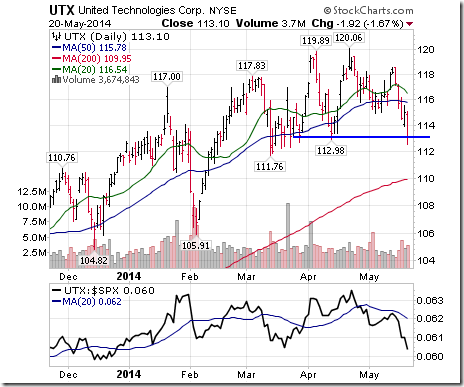
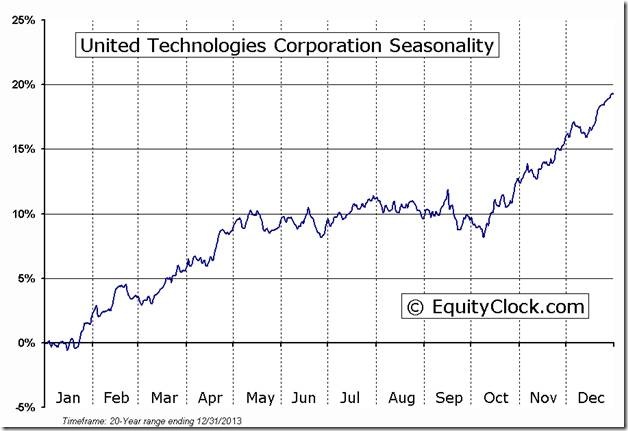
Another DJIA stock bites the dust. $UTX broke support at $112.98. Favourable seasonals have ended.
Technical Action by Individual Equities Yesterday
Technical action by S&P 500 stocks was quietly bearish yesterday. Nine stocks broke support (most were retail stocks) and three stocks broke resistance (ABC, NSC, INTU).
No significant technical action was recorded by TSX 60 stocks!
Special Free Services available through www.equityclock.com
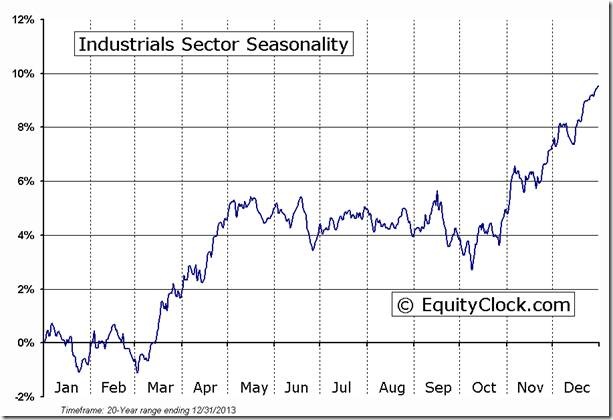
Equityclock.com is offering free access to a data base showing seasonal studies on individual stocks and sectors. The data base holds seasonality studies on over 1000 big and moderate cap securities and indices. To login, simply go to http://www.equityclock.com/charts/
Following is an example:
INDUSTRIAL Relative to the S&P 500 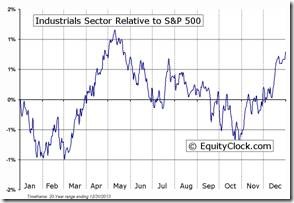 |
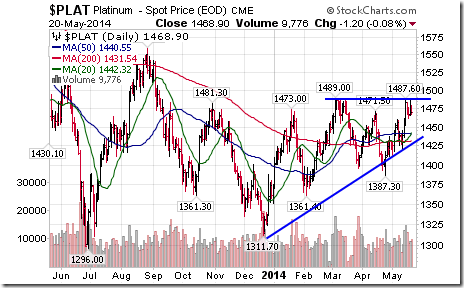
FP Trading Desk Headline
Headline reads, “Strike fails to provide major boost to platinum prices”. Following is a link:
http://business.financialpost.com/2014/05/20/strike-fails-to-provide-major-boost-to-platinum-prices/
Editor’s Note: Seasonal influences are positive until the end of May. A move above $1,489.00 will attract technical buying.
Disclaimer: Comments, charts and opinions offered in this report by www.timingthemarket.ca and www.equityclock.com are for information only. They should not be considered as advice to purchase or to sell mentioned securities. Data offered in this report is believed to be accurate, but is not guaranteed. Don and Jon Vialoux are Research Analysts with Horizons ETFs Management (Canada) Inc. All of the views expressed herein are the personal views of the authors and are not necessarily the views of Horizons ETFs Investment Management (Canada) Inc., although any of the recommendations found herein may be reflected in positions or transactions in the various client portfolios managed by Horizons ETFs Investment Management (Canada) Inc.
Twitter comments (Tweets) are not offered on individual equities held personally or in HAC.
Horizons Seasonal Rotation ETF HAC May 20th 2014
Copyright © Don Vialoux, Jon Vialoux, Brooke Thackray


![clip_image002[5] clip_image002[5]](https://advisoranalyst.com/wp-content/uploads/2019/08/21f5f360722179bc37eafc5aa9e80d42.png)


