by Adam Butler, http://gestaltu.com
Risk Parity seems to have (temporarily?) lost its place near the top of the institutional asset allocation wish list, no doubt because it proved vulnerable to policy shocks during last year’s central bank equivocation. Nevertheless we continue to believe the concept is valuable if thoughtfully applied.
Recall that risk parity has the objective of distributing portfolio risk equally among all available drivers of returns or asset classes. We wrote extensively on structural diversification, as well as naïve and robust approaches to risk parity last year, and would encourage readers to (re)visit these articles to refresh their understanding. At its core, risk parity is about diversification in the truest sense of the word. That is, investing in a basket of asset classes that have the ability to protect wealth in any economic environment.
Clearly, not all assets work in every economic regime, so diversification necessarily implies a compromise: you will never hold 100% of the best performing asset in any year. In return for sacrificing this lottery type payoff, you are compensated by never holding 100% of the worst performing asset. The importance of this latter point cannot be overstated. That’s because losses in the portfolio have a much larger impact on long-term growth than gains. To understand why, consider that a portfolio that endures a 50% loss requires a 100% gain to get back to even.
There is a high probability of positive returns to a diversified portfolio in most years. Calendar 2013 was an exception as half of the world’s major asset classes delivered negative returns. Even worse, the assets normally associated with safety and stability delivered some of the worst returns of the lot. For example, high-grade corporate bonds lost 2%, intermediate Treasury bonds lost 6%, and long-duration Treasuries lost over 13%. Of course the real loser last year was gold, which was down a whopping 28%.
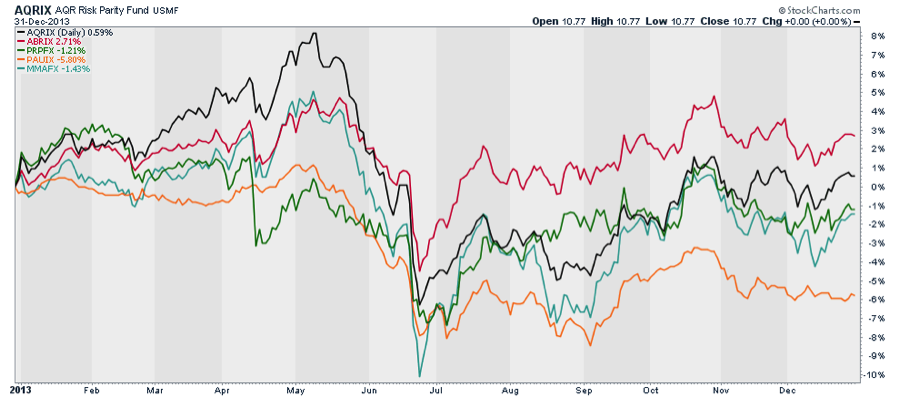
As a result, several of the large risk-parity based funds that are popular among sophisticated institutions reported flat or negative performance in 2013 despite great performance from developed equity markets. The “granddaddy” of these risk-parity based funds, Bridgewater’s All Weather fund, lost 3.9%, while other large funds turned in similar performance. On an equal weighted basis, the 5 risk parity type funds below in Figure 1. plus Bridgewater’s All Weather (not shown, as it does not publicly disclose monthly returns), lost 1.5% on the year.
Figure 1. Summary of 2013 Performance for Major Risk Parity Funds

Source: Stockcharts.com
Of course, now that risk parity is yesterday’s idea it is starting to outperform again. The same funds above are up 4.2% on average so far in 2014 versus global stocks up 1.9%, and U.S. balanced funds up 2.1%. Never fails.
Again, we think risk parity strategies have substantial merit when thoughtfully applied. To that end, we continue to investigate better, quicker, and more stable methods for deriving risk parity portfolio weights. When a brilliant French friend of hours (thanks Francois!) sent us an article by Florin Spinu entitled An Algorithm for Computing Risk Parity Weights we were intrigued enough by the approach that we decided to code it up for testing.
As a reminder, the original Equal Risk Contribution algorithm proposed by Maillard, Roncalli and Teiletche [2008] seek the portfolio weights which equalize the total risk contribution of each asset in the portfolio after accounting for diversification effects. The 2008 Maillard et. al. formulation can be expressed using the following objective function, which converges toward the portfolio that minimizes the sensitivity of the portfolio volatility to changes in asset weights:

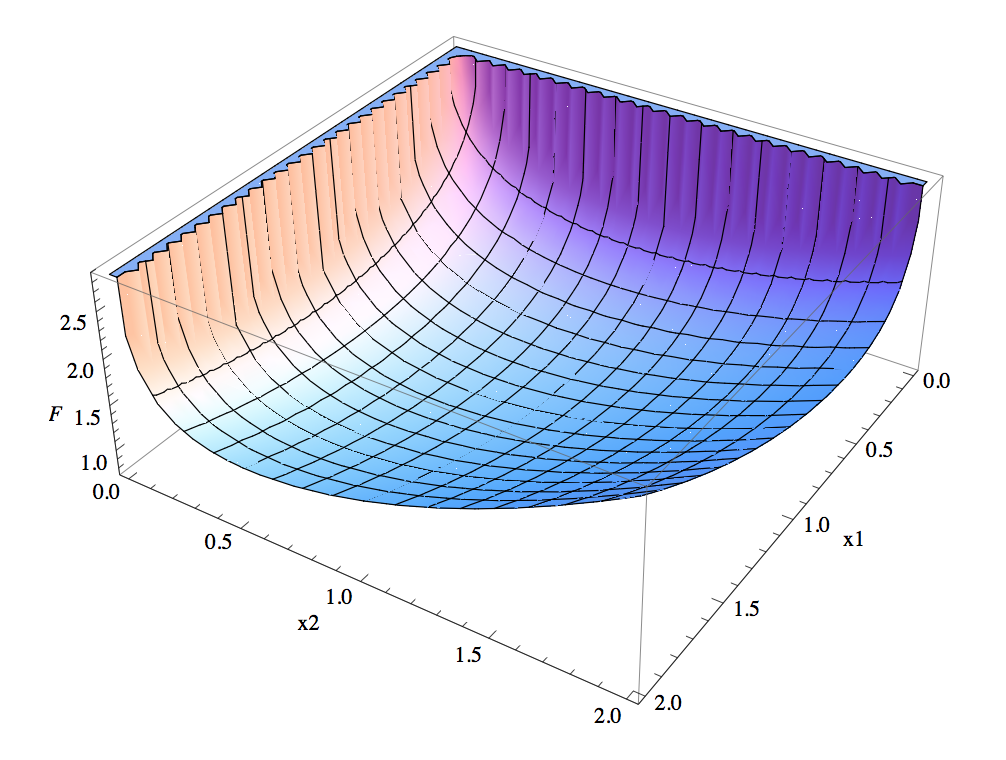
However, in performing a 2D analysis of this objective function it became clear that it is not strictly convex, a fact which Maillard et. al. noted in their original paper. (Those interested in a more great article on risk parity are encouraged to visit Roncalli’s risk parity page). In fact, it appears to contain saddle points (local minima) and the potential for large flat regions, as can be seen in Figure 2. below.
Figure 2. 2D analysis of Maillard et. al original ERC objective function
A large flat region may cause the algorithm to halt convergence before reaching the true global minimum if it reaches its stopping tolerance. Saddle points may cause the algorithm to converge on weight vectors which appear to be global minima, but which in fact are only minima within one section of the search space. These will both result in sub-optimal portfolios which have the potential to meaningfully impact performance, as we will demonstrate below.
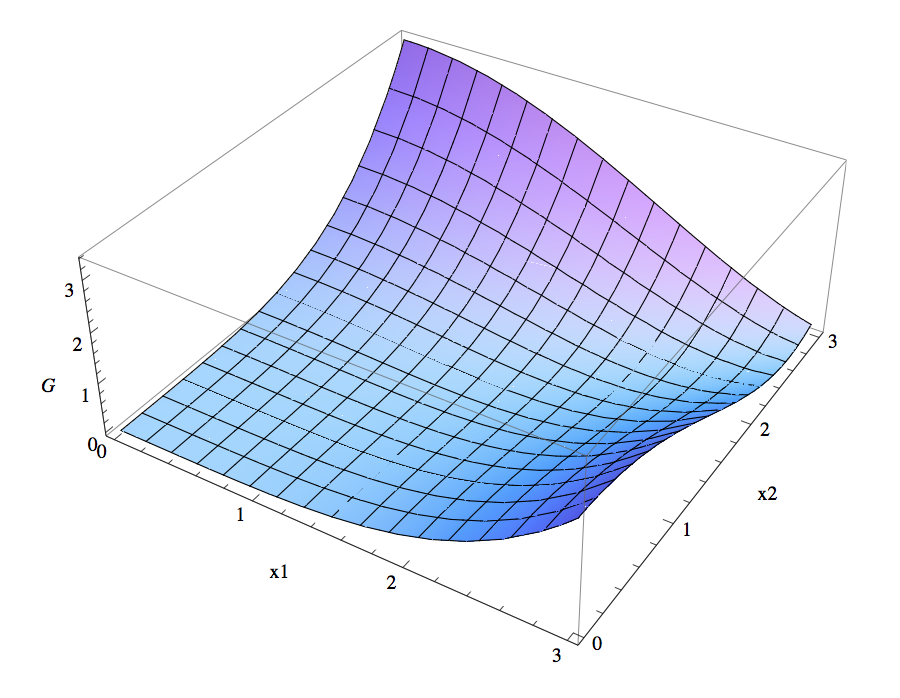
Spinu (2014) approached the problem with concepts originally proposed by Nesterov (2004) in order to create a strictly convex objective function of the following form and shape [Figure 3]. Its convex shape makes it a perfect candidate for global ERC optimization, provided the algorithm is specified with a sufficiently small and reliable stopping tolerance, because it will always converge toward a single unique global solution. 
Figure 3. 2D analysis of Spinu ERC objective function
It’s worth noting that the global minimums of F(x) and G(x) are the same. That is, if the weight vector x minimizes F(x) it must also minimize G(x). However, the objective surface of G(x) is not so obviously minimized because it is not strictly convex.
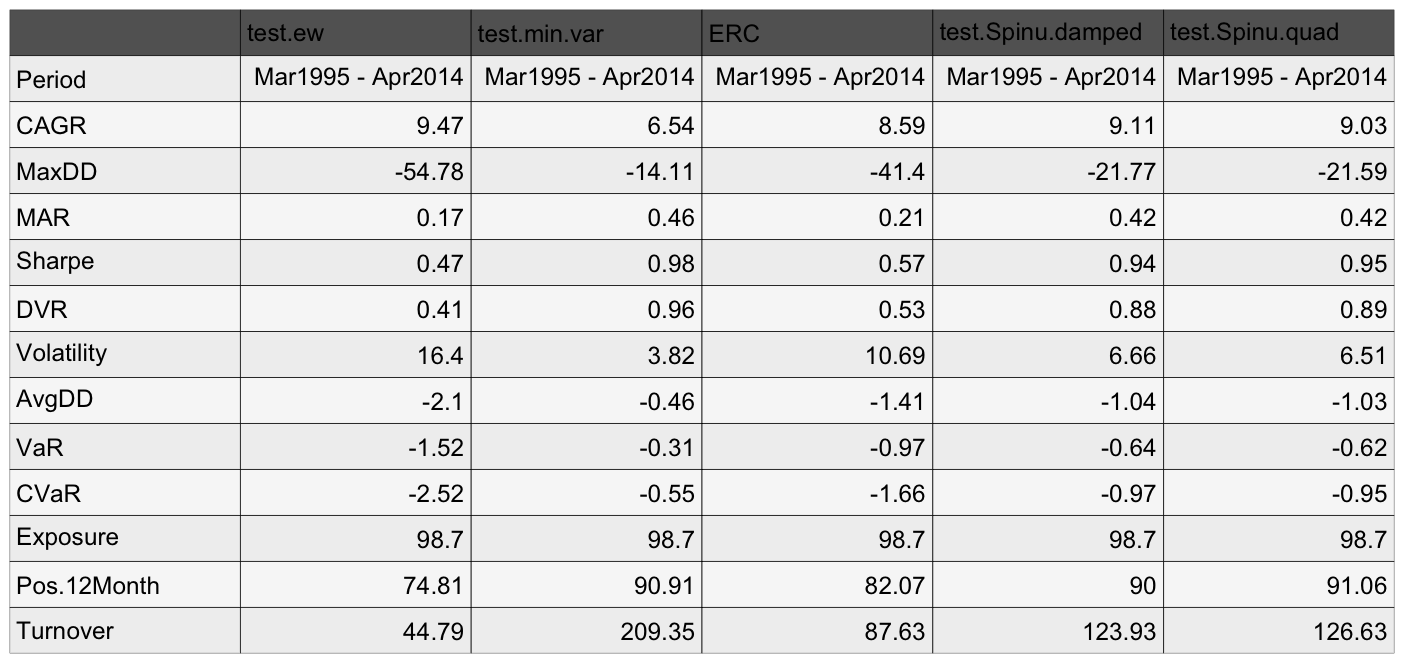
The importance of this nuance is easy to see empirically, so we constructed a Spinu optimization function to be compatible with the Systematic Investor Toolbox and ran some tests. We compared traditional and Spinu ERC optimizations, along with traditional minimum variance and equal weight portfolios, using the following 10 broad asset class universe: DBC, EEM, EWJ, GLD, IEF, IYR, RWX, TLT, VGK, and VTI. Portfolios were rebalanced quarterly based on the historical 250 day rolling covariance matrix (shrinkage made no difference). Results are shown in Figure 4.
Note that Spinu proposed a ‘damped’ version of the traditional optimization to reduce the steps to convergence of the algorithm, which we have included in our analysis.
Figure 4. ERC comparison table, 10 asset universe
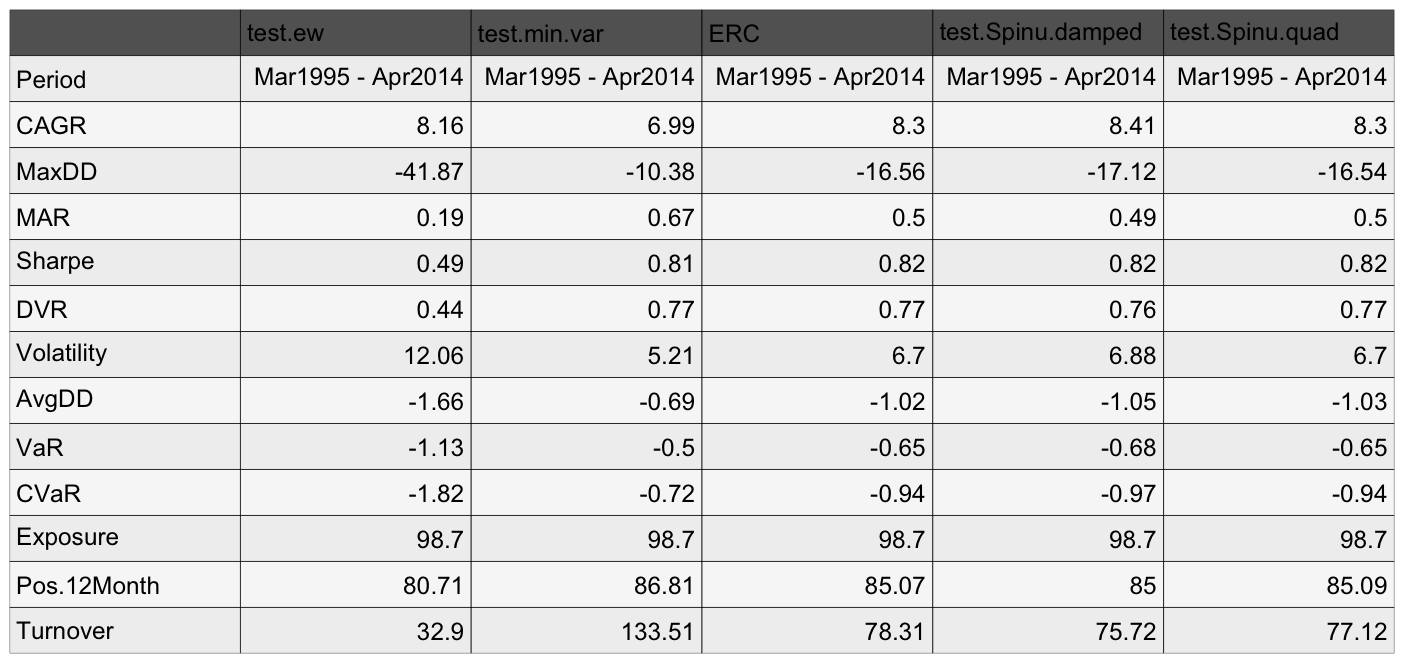
In this first case we can see that the results for traditional ERC and Spinu ERC are consistent for this smaller universe with more stable covariance characteristics. The traditional ERC is much less likely to converge to local minima in this simple low-dimensional case. Further, note that the ERC portfolios perform as expected in terms of delivering a performance profile between those of equal weight and the minimum variance optimizations.
In contrast, Figure 5 demonstrates the potential for the original algorithm to deliver sub-optimal ERC construction when applied to a larger, noisier asset universe, and how the Spinu implementation solves the problem quite neatly.
Figure 5. ERC omparison table, 58 asset universe

With this larger, noisier universe it is clear that the Spinu formulation delivers more stable ERC portfolios than the original Maillard method. This is validated by observed higher returns with about 40% less volatility, and about half the drawdown during 2008/9. Also note the substantial reduction in CVaR and improvement in rolling positive 12-month periods.
You may be wondering how the traditional ERC and Spinu ERC implementations differ in terms of average asset allocations, so we show the average asset allocations for both in Figure 6. Of particular note, the Spinu method does a better job of identifying the diversification characteristics of non-equity assets, giving higher weights across the board to Treasury bonds, TIPs, commodities, and gold at the expense of emerging market and high yield bonds, which have equity-like characteristics.
Figure 6. Average asset allocation

We’ve established (I hope) that the Spinu objective function is superior to the original formulation because it is strictly convex, and therefore always converges on the global optimal portfolio. This is enough to compel further investigation on its own. But in fact there is another reason why the Spinu method is more flexible than the standard formulation. It pertains to the second term in the Spinu function:
The 1/N part of the term specifies that the function will find the portfolio where each asset contributes an equal 1/N portion of total portfolio volatility. This is consistent with the intuition behind ERC. However, ERC implicitly assumes that we know nothing about relative portfolio returns (or that all assets have equal Sharpe ratios). If we have estimates for portfolio returns, then we may wish to construct a portfolio where each asset contributes total risk to the portfolio in proportion to its marginal return. This would represent a slight deviation from a traditional mean variance optimization which seeks the portfolio which maximizes total portfolio return per unit of risk. We will discuss this concept in a future post. In the meantime, those of you who are running, or considering running, risk parity portfolios would be wise to investigate whether the Spinu method might improve results.
The post Do You Spinu? A Novel Equal Risk Contribution Method for Risk Parity appeared first on GestaltU.
Source link