by Don Vialoux, Timing the Market
Interesting Charts
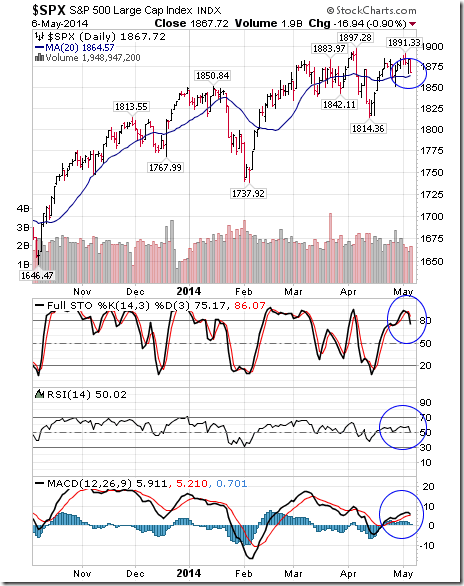
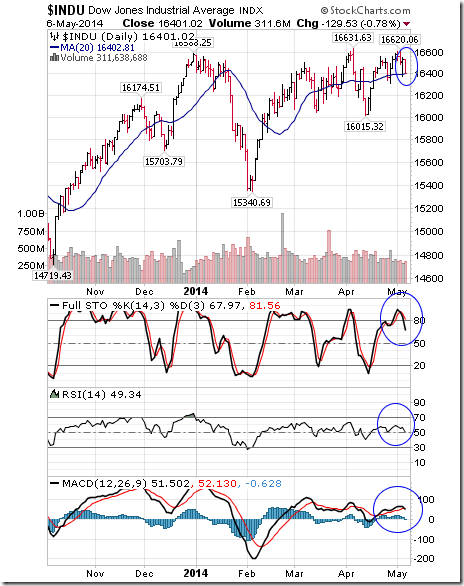
Early technical signs of weakness by the S&P 500 and Dow Industrials! Short term momentum indicators are rolling over from overbought levels. Both are testing their 20 day moving average. The Dow closed slightly below its 20 day moving average. The rollover is occurring shortly after the average optimal date for the end of the period of seasonal strength for U.S. equity indices (i.e, May 5th).
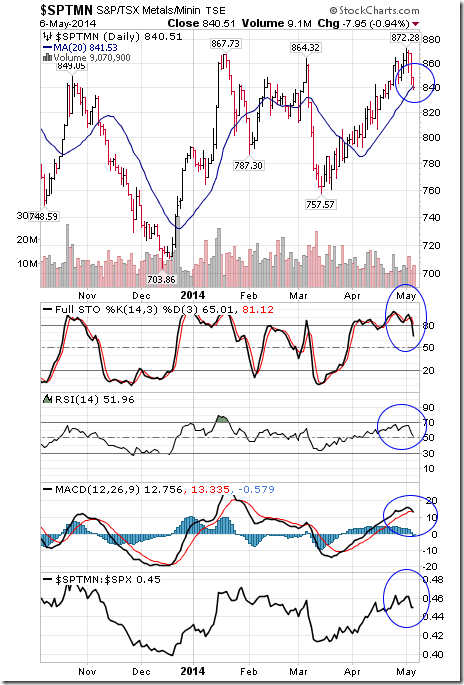
Ditto for the S&P/TSX Metals & Mining Index at the end of its period of seasonal strength! The Index fell below its 20 day moving average; recorded short term momentum sell signals (e.g. Stochastics falling below 80%) and began to underperform the S&P 500 Index and the TSX Composite Index.
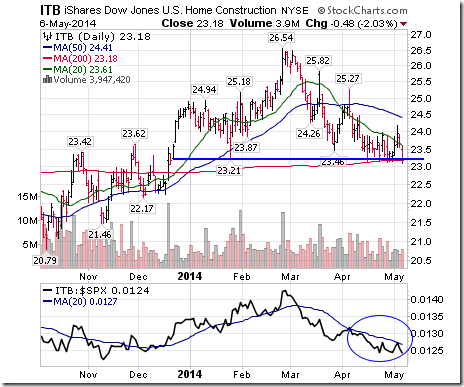
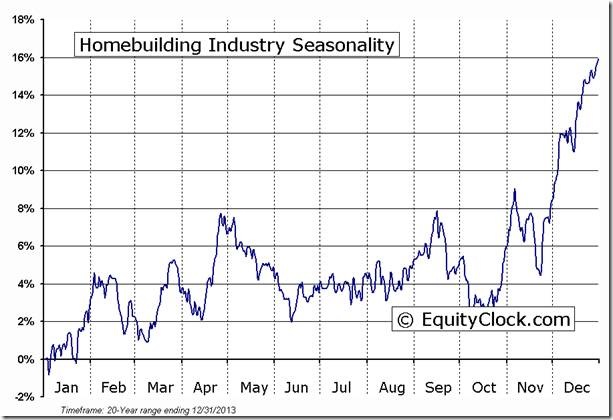
Home builder equities and related ETFs also are showing dangerous technical signs as they enter into a period of seasonal weakness. Head and shoulders pattern?
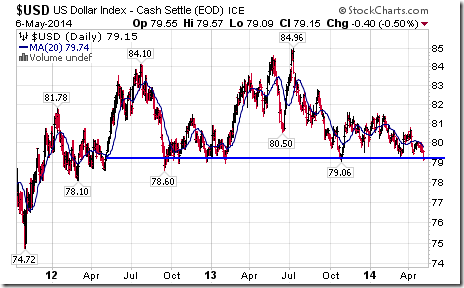
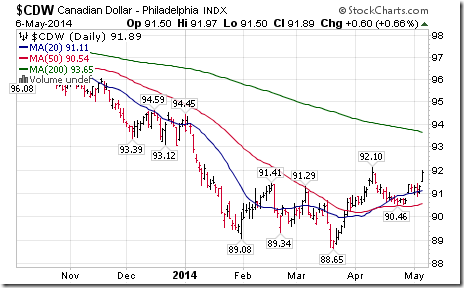
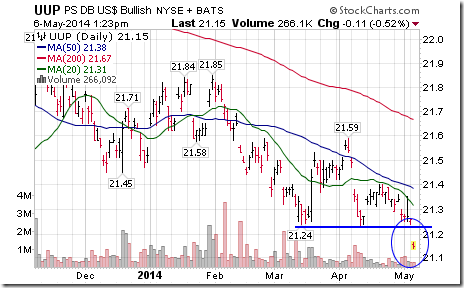
Currencies were a focus yesterday. Weakness in the U.S. Dollar triggered exceptional strength in other international currencies including the Canadian Dollar and Euro. The U.S. Dollar Index closed at an 18 month closing low and appears to be forming a long term head and shoulders pattern.
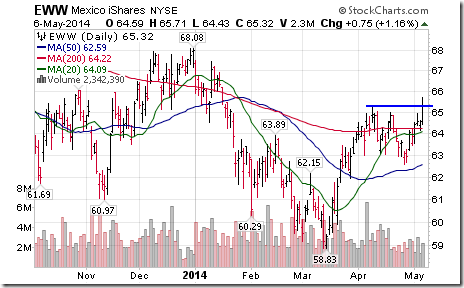
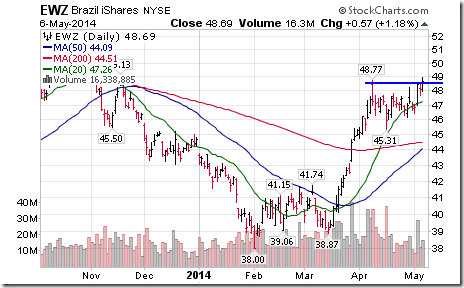
Selected American equity markets outside the U.S. and their related ETFs continue to show positive technical action.
Tech Talk Tweets Released Yesterday
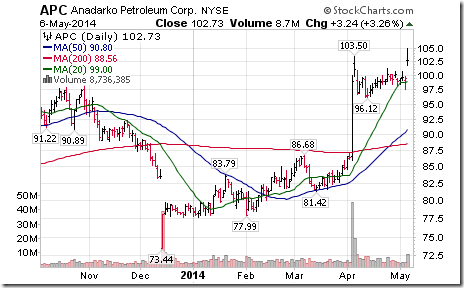
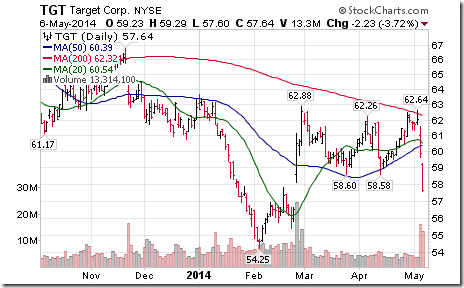
Bearish technical action this morning. S&P 500 stock breakdowns: $PETM, $TGT, $TJX, $L, $PFE, $CA. Breakouts: $APC, $EOG
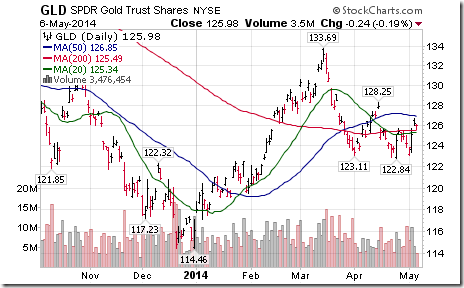
Strange! $UUP breaks to a 2.5 year low today, but $GLD moves lower.
Editor’s Note: UUP is the Bullish ETF on the U.S. Dollar Index
Technical Action by Individual Equities Yesterday
Technical action by S&P 500 stocks at the close was mildly bearish. Six stocks broke resistance and nine stocks broke support. Notable among stocks breaking resistance were energy stocks. Notable among stocks breaking support were Consumer Discretionary stocks.
Special Free Services available through www.equityclock.com
Equityclock.com is offering free access to a data base showing seasonal studies on individual stocks and sectors. The data base holds seasonality studies on over 1000 big and moderate cap securities and indices. To login, simply go to http://www.equityclock.com/charts/
Following is an example:
S5HOME Index Relative to the S&P 500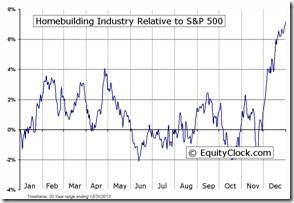 |
S5HOME Index Relative to the Sector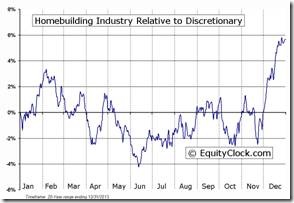 |
FP Trading Desk Headline
FP Trading Desk headline reads, “David Rosenberg: Canadian Dollar short positions look overdone”. Following is a link:
Disclaimer: Comments, charts and opinions offered in this report by www.timingthemarket.ca and www.equityclock.com are for information only. They should not be considered as advice to purchase or to sell mentioned securities. Data offered in this report is believed to be accurate, but is not guaranteed. Don and Jon Vialoux are Research Analysts with Horizons ETFs Management (Canada) Inc. All of the views expressed herein are the personal views of the authors and are not necessarily the views of Horizons ETFs Investment Management (Canada) Inc., although any of the recommendations found herein may be reflected in positions or transactions in the various client portfolios managed by Horizons ETFs Investment Management (Canada) Inc.
Twitter comments (Tweets) are not offered on individual equities held personally or in HAC.
Horizons Seasonal Rotation ETF HAC May 6th 2014
Copyright © Don Vialoux, Jon Vialoux, Brooke Thackray


