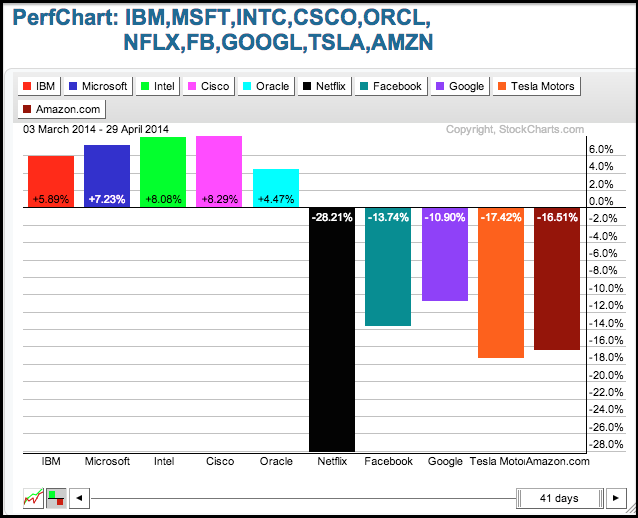
The S&P 500 is up around 1.75% over the last two months, but the Nasdaq is down around 4%. Part of the reason for this discrepancy can be found in the performance of ten key tech stocks. The PerfChart below shows IBM, Microsoft, Intel, Cisco and Oracle with gains over the last 41 trading days. In contrast, Netflix, Facebook, Google, Tesla and Amazon are down, and down rather sharply. The old guard is holding up the market right now and showing some serious relative strength.

Click this image for a live Chart
Copyright © StockCharts.com Blog


