by Don Vialoux, Timing the Market
Apr 29
Technical action yesterday in individual
equities
Technical action by S&P 500 stocks was extraordinary.
Seventeen stocks broke support (mainly late morning) and 13
stocks broke resistance.
Among TSX 60 stocks, Saputo was notable for its upside
breakout to an all-time high.
Tweets forwarded yesterday (With charts added)
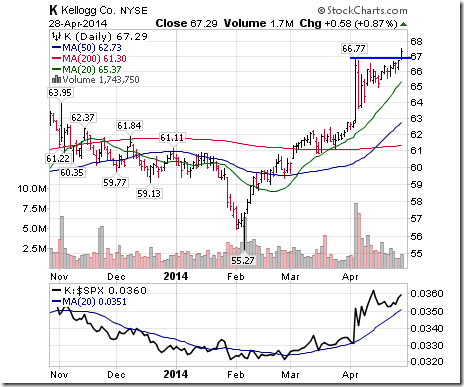
Nice breakout by $K above resistance at $66.77 to an all-time
high. One of Jon’s picks on BNN. See seasonality chart:
http://charts.equityclock.com/kellogg-company-nysek-seasonal-chart
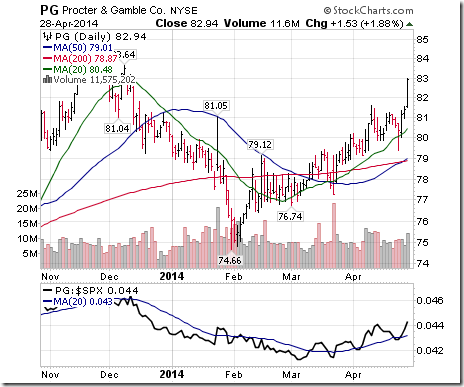
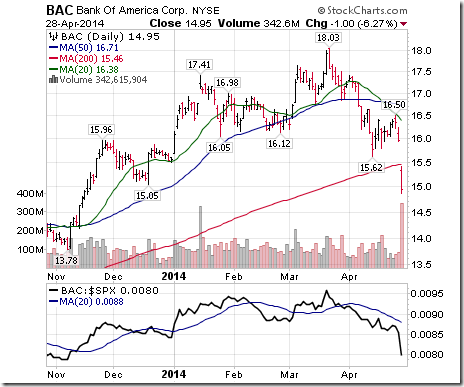
Mild bullish technical action this morning! Breakouts were
$SPLS, $K, $KO, $PG, $PM, $AIV, $XL. Breakdowns were $PCLN,
$BAC, $FFIV and $CLF
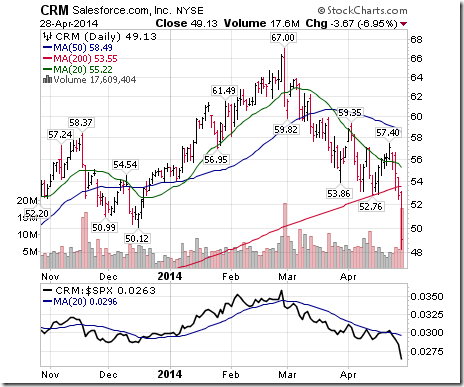
Technical action turned significantly bearish this afternoon.
$RAI broke resistance. $CMG, $DiSCA, $WAT, $CRM, $FLIR and
$TEL broke support
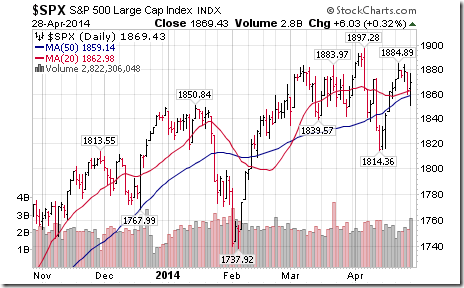
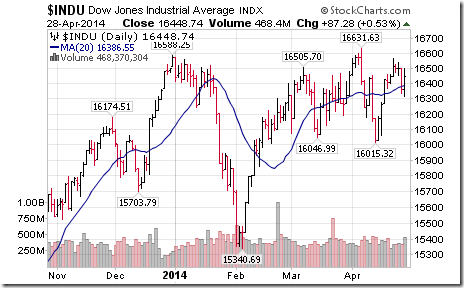
S&P 500 has fallen below its 20 and 50 day moving average
this afternoon. The Dow has fallen below its 20 day moving
average. Bearish!
Editor’s Note: Both the S&P 500 and Dow Industrials
recorded greater than average inter-day volatility yesterday,
typical of equity indices that are near an intermediate peak.
Volatility comes at a time when U.S. equity markets transit
from their period of seasonal strength (October
28th to May 5th) to their period of
volatility (May 6th to October 27th).
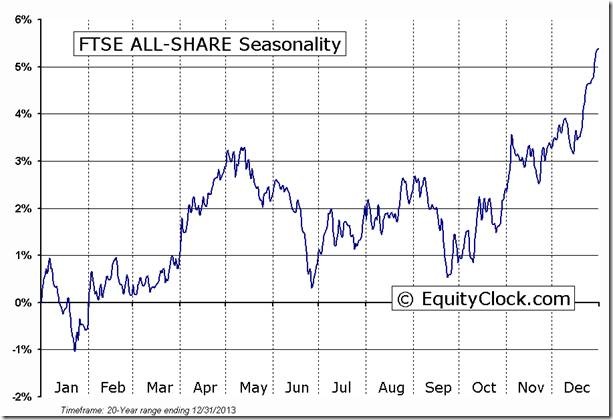
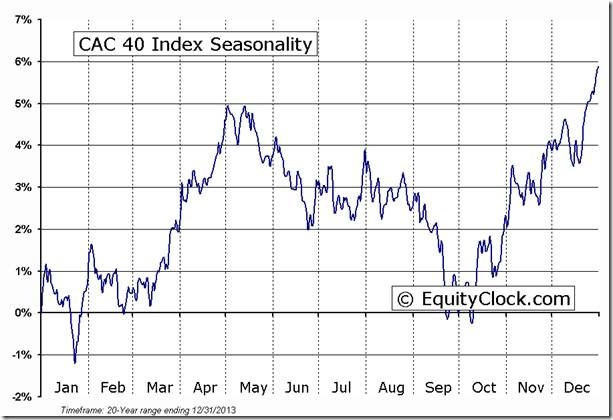
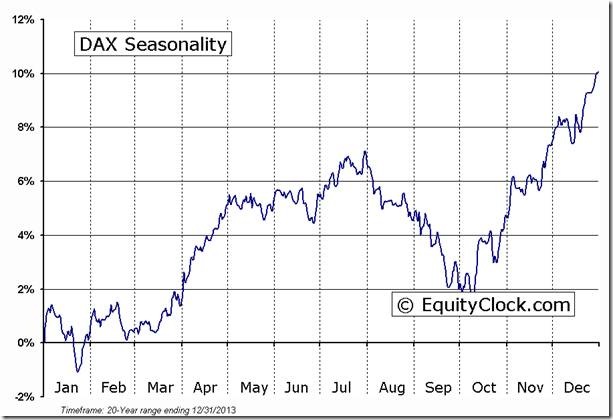
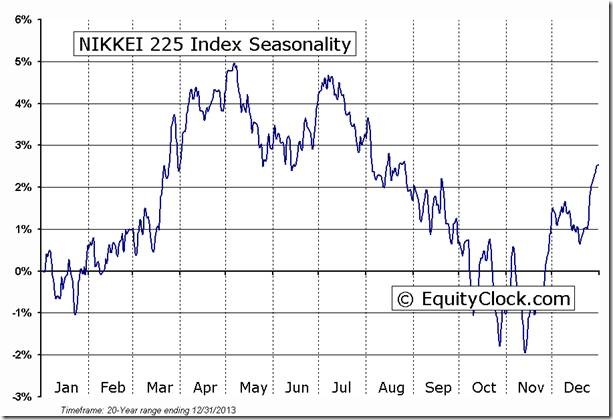
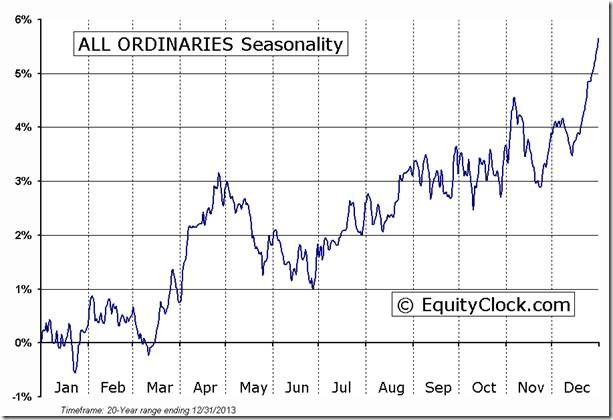
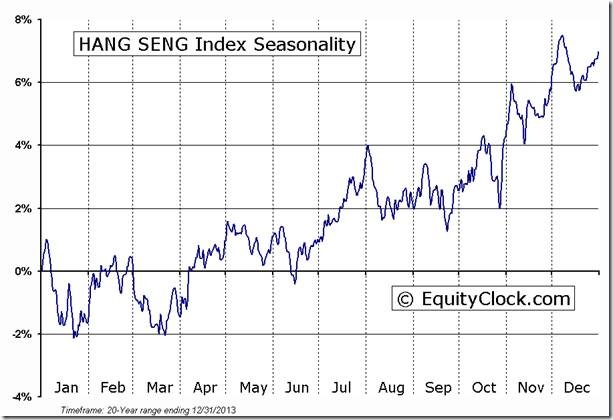
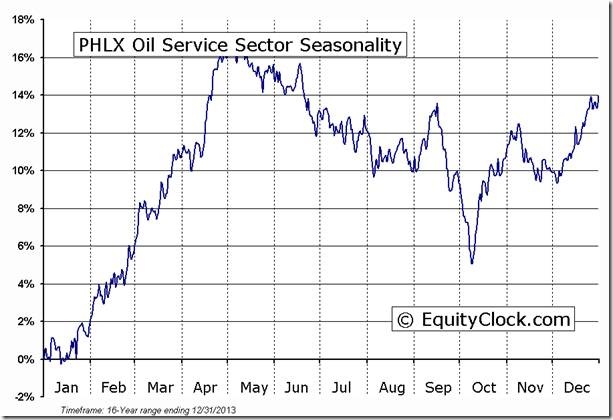
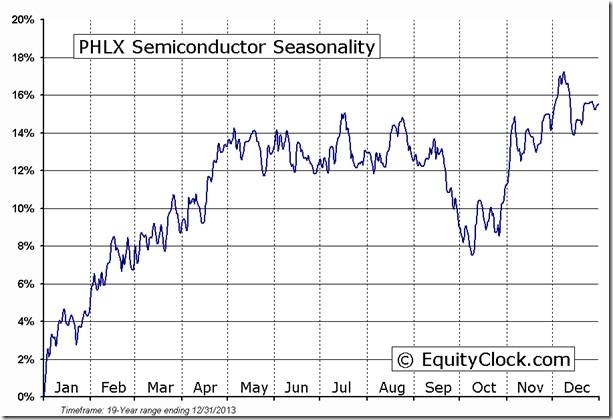
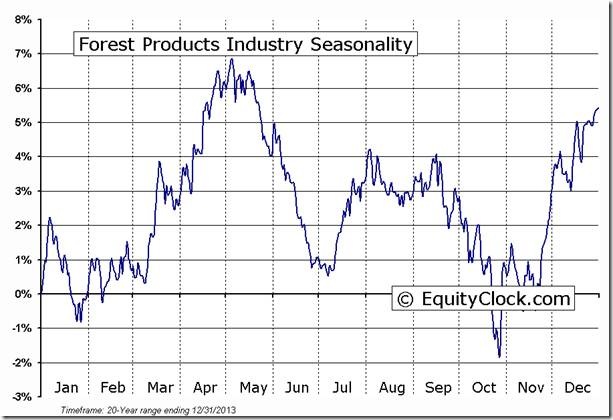
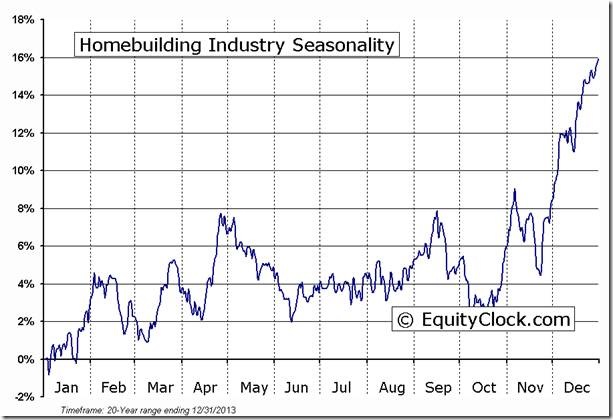
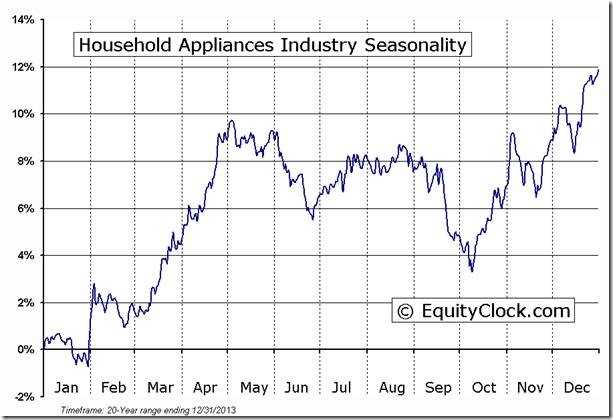
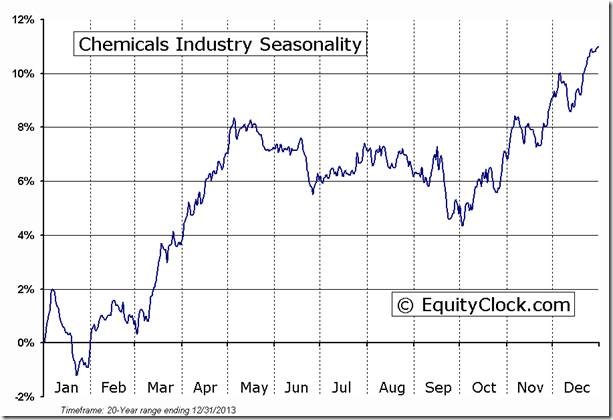
Market and Sector Seasonality That Historically
Peaks Near The End Of April
Following are the seasonal charts from www.EquityClock.com . A
examination of their price charts also show that most have
reached an intermediate peak during the past three weeks.
NIKKEI 225 Index Seasonal Chart
Chemicals Industry Seasonal Chart
Comments on Markets by Dave
Skarica
I have enclosed a new article on Addicted to Profits on why
the market is showing a lot of similarities to 1937 and what
these means for investors.
Please go to
www.addictedtoprofits.net to read it.
Tomorrow I will have a new video on the markets and how to
protect yourself against a potential bear market.
Sincerely,
David Skarica
Disclaimer: Comments, charts and opinions
offered in this report by www.timingthemarket.ca
and www.equityclock.com
are for information only. They should not be
considered as advice to purchase or to sell mentioned
securities. Data offered in this report is believed to be
accurate, but is not guaranteed. Don and Jon Vialoux are
Research Analysts with Horizons ETFs Management (Canada)
Inc. All of the views expressed herein are the personal
views of the authors and are not necessarily the views of
Horizons ETFs Investment Management (Canada) Inc., although
any of the recommendations found herein may be reflected in
positions or transactions in the various client portfolios
managed by Horizons ETFs Investment Management (Canada)
Inc.
Twitter comments (Tweets) are not offered on
individual equities held personally or in HAC.
Horizons Seasonal Rotation ETF HAC April
28th 2014
Leave a Reply
Copyright © Don Vialoux, Jon Vialoux, Brooke Thackray


