


For this weeks edition of the SIA Equity Leaders Weekly, we are going to take a look at the International Equity market, specifically looking at the Emerging and Developing markets. Since International Equity moved into Favor in the SIA Asset Allocation rankings in late 2012, SIA's analysis takes it a step further to see if we should be in Developed or Emerging markets according to their relative strength. This analysis has shown Developed as the Favored area of focus in SIA International Equity and over the last year EFA (Developed markets) has outperformed EEM (Emerging markets) by ~15.26%.
iShares MSCI EAFE ETF (EFA)
The iShares MSCI EAFE ETF(EFA) tracks 21 developed markets country indexes excluding the U.S. and Canada and is an example of a benchmark for analyzing developed markets outside North America. As we can see in the chart, EFA has been on an upwards trend over the last 20 months and has hit a resistance level at $68.52 with further resistance right above this at $71.29 from its prior high in November of 2007.
To the downside, support can be found at $62.06 and below this at $56.21. EFA has a short-term strength score of 7 out of 10. For those looking to see where more of the strength is coming from within the Developed Markets, we recommend checking out the "SIA International Equity Developed Markets" ETF Report to see which specific Developing nations are providing the best relative strength and upside going forward. For example, the top three ETFs in this report have averaged ~47.6% over the past year at the top of the Favored zone of the report.
Click on Image to Enlarge

iShares MSCI Emerging Markets ETF (EEM)
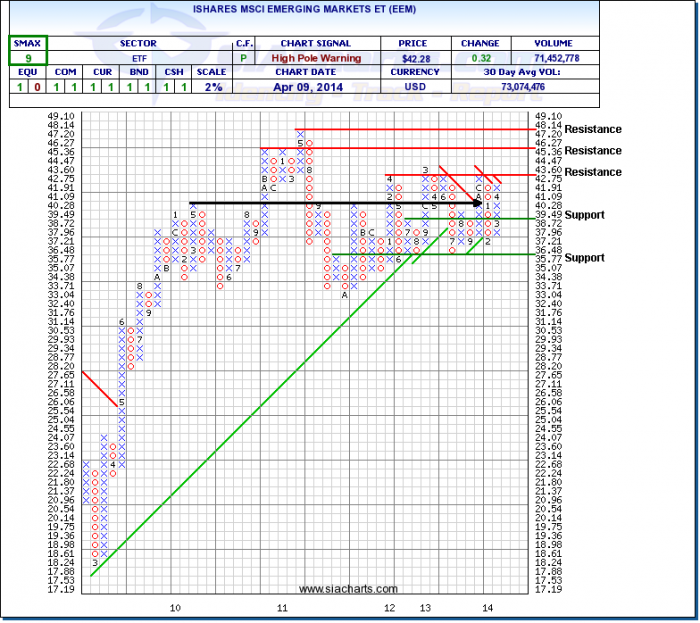
The second comparison chart we are going to look at today is the iShares MSCI Emerging Markets ETF (EEM) which follows 21 emerging market country indexes. The trend of this ETF as you can see with the black arrow has been relatively sideways movement over the last 4 years while underperforming versus its Developed counterpart. EEM is approaching resistance above at $43.60 with further resistance found at $46.27 and at $48.14 should this short term strength continue.
To the downside, support can be found at $38.72 and at the bottom of the trading range over the past couple of years at $35.77. EFA has seen some short-term strength over the last month or so showing an SMAX score of 9 out of 10. We will be keeping a close watch on the comparison between Emerging vs. Developed to see if the short-term strength of Emerging turns into longer-term strength and this relationship changes. For those looking for ideas within the Emerging Markets to see where this strength is coming from, we recommend checking out the "SIA International Equity Emerging Markets" ETF Report to see which specific Emerging nations are providing the best relative strength and upside going forward.
Click on Image to Enlarge
SIACharts.com specifically represents that it does not give investment advice or advocate the purchase or sale of any security or investment. None of the information contained in this website or document constitutes an offer to sell or the solicitation of an offer to buy any security or other investment or an offer to provide investment services of any kind. Neither SIACharts.com (FundCharts Inc.) nor its third party content providers shall be liable for any errors, inaccuracies or delays in content, or for any actions taken in reliance thereon.
Copyright © SIACharts.com


