With Commodities recently moving up into the 5th spot in the SIA Asset Class Rankings, advisors have been asking whether it is time to be moving back in. For this weeks edition of the SIA Equity Leaders Weekly we are going to look at a broad based Commodity ETF as well as a comparison between that ETF and one of top asset classes, to see whether now is the time to moving back into Commodities.
iShares Broad Commodity ETF CAD ( CBR.TO)
Looking at the chart you can see that right now CBR.TO is sitting on a support level it last saw back in 2012, at $20.95. If this level should break then the next support is around $20.00, giving it some room to potentially move quite a bit lower. With the SMAX sitting at 1, CBR.TO is also showing short term weakness against all the asset classes. Thus far, there really isn't much to get excited over and it doesn't really look like a strong place to place assets just yet.
Click on Image to Enlarge

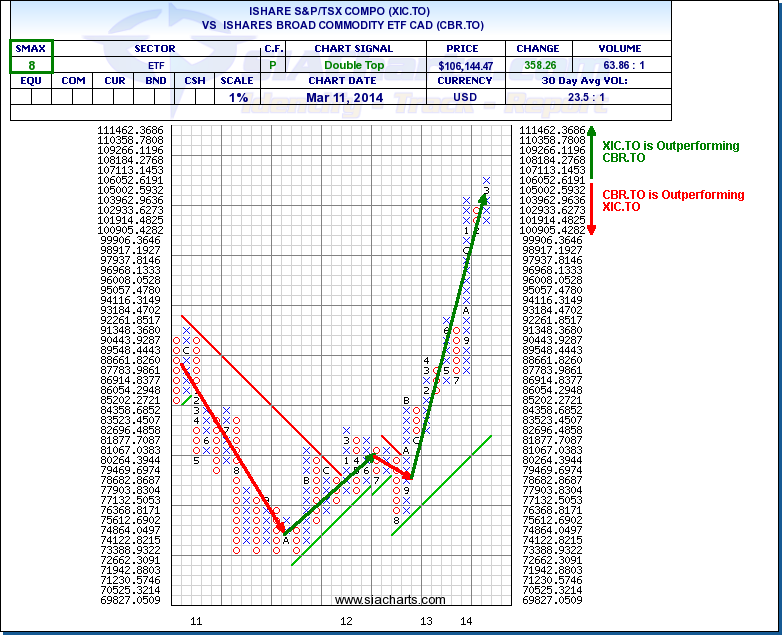
Ishares S&P/TSX Composite vs. iShares Broad Commodity ETF (XIC.TO^CBR.TO)
But how does it compare against other asset classes right now? Well, we know that Commodities are currently 5th overall but let's do a direct comparison against XIC.TO since Canada is really a resource driven economy. From the chart we can see that except a brief period in the 3rd quarter of 2012, the XIC.TO has been outperforming against CBR.TO since the final quarter of 2011 and has moved to new highs in the comparison this month.
Although we have seen some short term strength recently in a few Commodities, overall there has been no indication that this relative strength relationship has changed, and that the relative weakness by Commodities as a whole could hinder the continued progress of a select few Commodities that have been performing well as of late.
Click on Image to Enlarge
SIACharts.com specifically represents that it does not give investment advice or advocate the purchase or sale of any security or investment. None of the information contained in this website or document constitutes an offer to sell or the solicitation of an offer to buy any security or other investment or an offer to provide investment services of any kind. Neither SIACharts.com (FundCharts Inc.) nor its third party content providers shall be liable for any errors, inaccuracies or delays in content, or for any actions taken in reliance thereon.