For this weeks SIA Equity Leaders Weekly, we are going to update a recent outlook on the S&P 500 Index. Taking a look at a shorter term and a longer term Point and Figure chart of the S&P 500 can give us some more insight into what we might expect moving forward with the U.S. Equity markets.
S&P 500 Index (SPX.I)
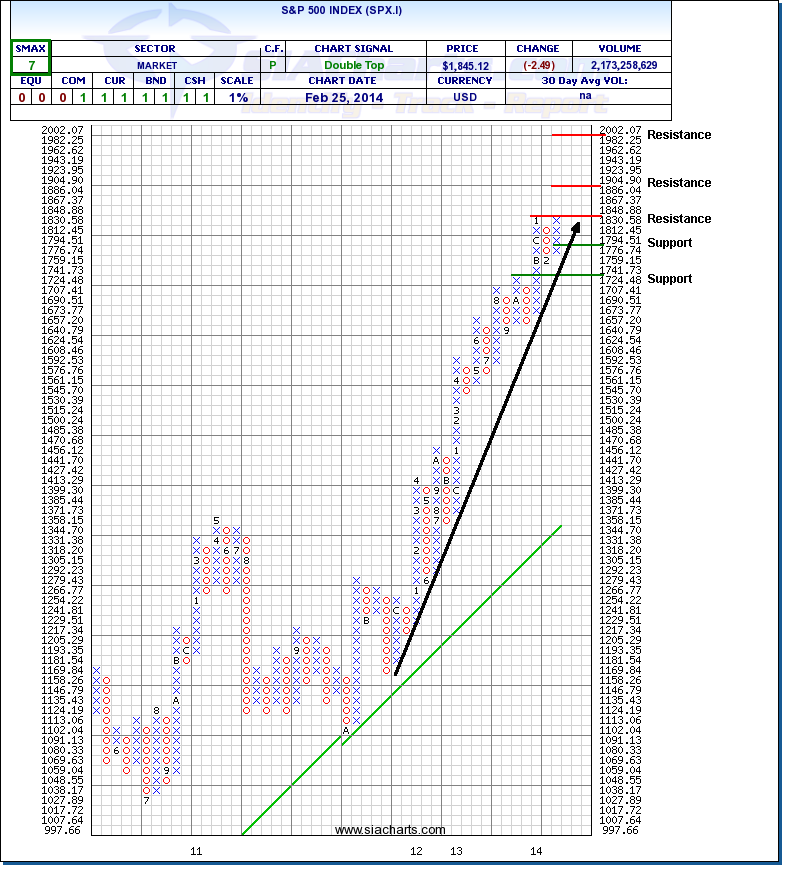
Three weeks ago we looked at the S&P 500 Index on a 1% scale, as the market had started the year off with a little dip, to help put into context that these little pullbacks have been common over the past few years as the S&P 500 has moved upwards to new highs after each one of them so far. The chart to the right shows us that this pullback was brief as the S&P 500 has already fully recovered from this and is now up against the resistance level at 1848.88 looking to move through this level. Further resistance above on a 1% scale of the SPX.I is found at 1904.9 and around the 2000 level, which could prove to be tougher resistance when you factor in the psychological barriers this level may present for investors.
We commented 3 weeks ago that "this pullback is still a healthy, short term reversal like the others and we continue on with our rules based strategies." Although these short term pullbacks could absolutely turn into longer term weakness at any time, hopefully by sticking with a relative strength strategy, it can help calm short term fears keeping you in the market with long term goals in mind for your clients.
Click on Image to Enlarge
S&P 500 Index (SPX.I)
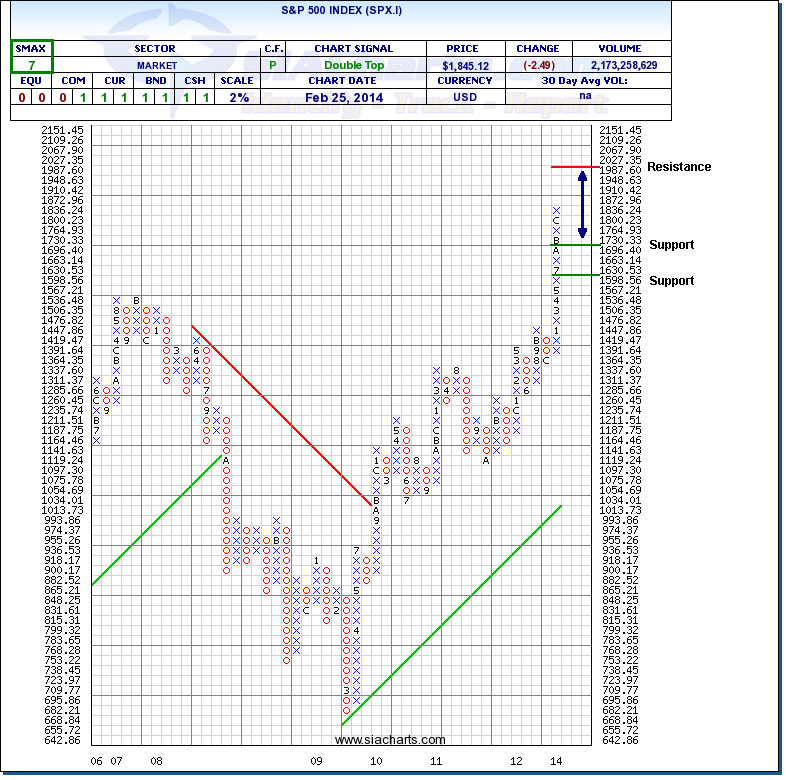
Now looking at the same S&P 500 Index but on a 2% scale, increasing the percentage scale increases the outlook we have for this equity benchmark and our time horizon eliminating more of the short term noise in the market. Not much has changed on this chart since we looked at it in late November as it eliminates much of the short-term pullbacks that the 1% displays.
This chart shows the S&P 500 hasn't had more than a 6% pullback in over 14 months. To the upside, resistance is found at 2027.35 (which coincides with the 2002 level as well we saw on the 1% scale chart above) giving us another possible 8% potential move. To the downside, we can find support above 1696.40 and around 1600. U.S. Equity still looks to be a strong equity play moving forward with the SMAX score showing short term strength score of 7 out of 10.
For more information about when to use a 1% or 2% scale when analyzing stocks or other investments, consider the time frame you want to analyze with the higher # representing a longer time frame. Please contact SIACharts directly to learn more about logarthimic scaling for point and figure charts.
Click on Image to Enlarge
SIACharts.com specifically represents that it does not give investment advice or advocate the purchase or sale of any security or investment. None of the information contained in this website or document constitutes an offer to sell or the solicitation of an offer to buy any security or other investment or an offer to provide investment services of any kind. Neither SIACharts.com (FundCharts Inc.) nor its third party content providers shall be liable for any errors, inaccuracies or delays in content, or for any actions taken in reliance thereon.
Copyright © SIACharts.com