With the recent movement from 7th to 5th that we have seen from Commodities in the SIA Asset Class Rankings, for this weeks SIA Equity Leaders Weekly we are going to look in on a couple of the most followed Commodities: Crude Oil and Gold.
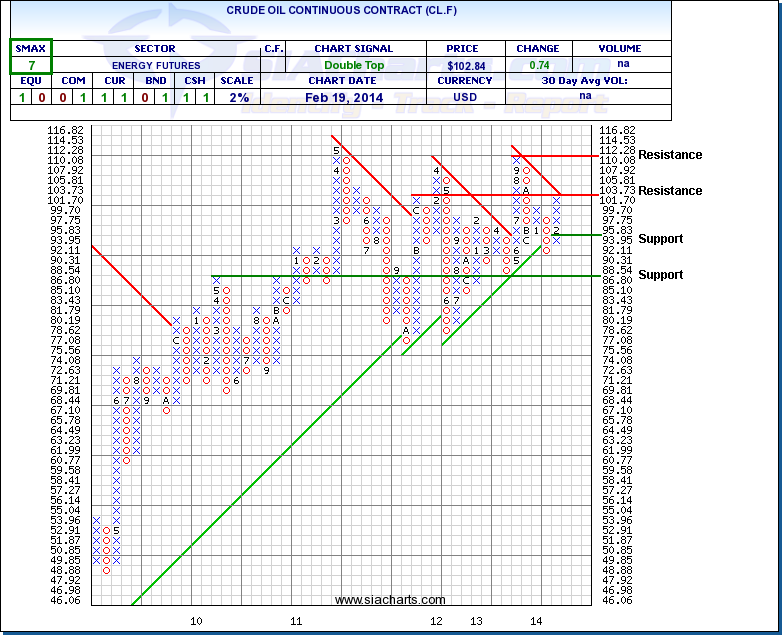
Crude Oil Continuous Contract (CL.F)
Looking at the chart for Crude Oil we can see that after a drop through the rising trendline that happened in January, there has been a sizable bounce back upwards, as CL.F is now again back above $100. The near term difficulty that Crude may see here is that it is now at a level of resistance that corresponds with the high from Dec. 2011, and also the newly formed declining trendline at $103.73. If this level does break, then the next resistance up at $112.28 may come into play, quickly followed by the high from May 2011 at $114.53.
Support is now at $93.95 and again below that at $86.80. Since we last looked at Crude 3 months ago the SMAX has also been on the move, now showing near term strength against the asset classes with a score of 7 out of 10.
Click on Image to Enlarge
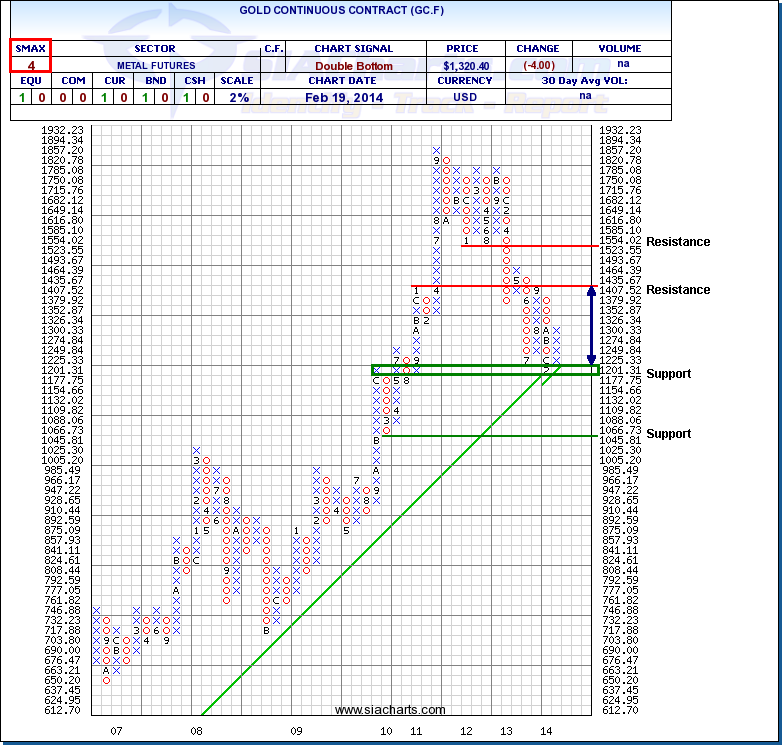
Gold Continuous Contract (GC.F)
Always a common point of interest is what is happening with Gold. From the chart we can see that for the most part Gold has been stuck in a channel for the last 3/4 of a year, between a high around the $1435 level and the low around $1200. Recently we have seen a bounce off that low and also off the rising trendline that has been in place for well over a decade. Both of these are important to watch, as a break down through both could be quite negative for Gold, as the next support is not until $1045.
With this bounce we have also seen a strengthening in the near term SMAX, but it is still showing a weak 4 versus the other asset classes.
As mentioned earlier, Commodities have now moved up to the 5th spot, and are now above Cash, but overall the longer term strength is still being seen in our different Equity classes.
Click on Image to Enlarge
SIACharts.com specifically represents that it does not give investment advice or advocate the purchase or sale of any security or investment. None of the information contained in this website or document constitutes an offer to sell or the solicitation of an offer to buy any security or other investment or an offer to provide investment services of any kind. Neither SIACharts.com (FundCharts Inc.) nor its third party content providers shall be liable for any errors, inaccuracies or delays in content, or for any actions taken in reliance thereon.