


February Sentiment Summary
Equities
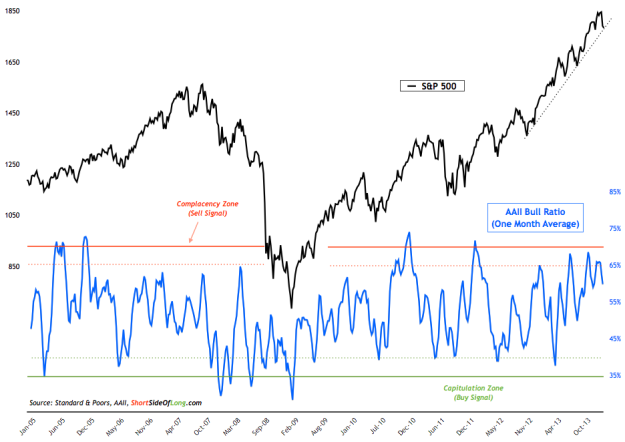
Chart 1: Individual investor optimism has just started to scale back

Source: Short Side of Long
- Recent AAII survey readings came in at 32% bulls and 33% bears. Over the last month, bullish readings have started to mean revert back towards a more neutral level as can be seen with a 4 week average of the AAII bull ratio. There seems to be quite a few blogs mentioning that the recent 4% correction has turned retail investors bearish, but the chart above clearly shows that we are nowhere near capitulation zone, that is usually associated with intermediate market lows.
- Recent Investor Intelligence survey levels came in at 53% bulls and 15% bears. Bullish readings have pulled back slightly from the lofty levels we saw in the January sentiment report. While the mild correction has shook out a few bulls, bearish readings refuse to rise. Newsletter advisors remaining extremely complacent, should be one of the major risks for any stock market investor right now.
- Recent NAAIM survey levels came in at 71% net long exposure, while this weeks intensity was at -5%, recording a first cumulative net short reading since July 2013. Nonetheless one week doe snot make a trend, so when we average out fund manager intensity readings over the last couple of months, we can see that managers currently hold one of the most extreme bullish exposures since the surveys inception.
Chart 2: Despite a sell off, retail investors are plowing money into stocks

Source: Short Side of Long
- Recent ICI fund flows reports showed that “equity funds had estimated inflows of $6.41 billion for the week, compared to estimated inflows of $8.27 billion in the previous week. Domestic equity funds had estimated inflows of $2.45 billion, while estimated inflows to world equity funds were $3.96 billion.” However, contrasting the ICI report, Bloomberg recently reported that record amount of cash is now leaving Emerging Market Equity ETFs, stating that:
More than $7 billion flowed from ETFs investing in developing-nation assets in January, the most since the securities were created, data compiled by Bloomberg show. The iShares MSCI Emerging Markets ETF has seen its assets shrink by 11 percent, while the Vanguard FTSE Emerging Markets ETF is poised for the biggest monthly redemption since the fund was started in 2005. The WisdomTree Emerging Markets Local Debt Fund is on track for an eighth straight month of withdrawals.
- Recent Rydex fund flows data remained at some of the most bullish readings on record. Nova Ursa fund flow indicator remains at highly elevated levels, mainly due to large outflows from the bearish funds. If this data is correct, it seems that the retail commodity is not even slightly bothered about a possibility of a major stock market top occurring right now.
- Recent commitment of traders reports (also known as dumb money) showed that hedge funds and other speculators continue to pull back on their net long exposure towards the tech heavy Nasdaq index. Hedge funds and other speculators currently hold almost 94,000 net long contracts, a slight reduction over the last month. However, consider that during the recent intermediate degree equity bottoms in August 2011 and July 2012, hedge funds were actually net short. In other words, we got a lot of shaking out to do before we see any proper signs of panic.
Chart 3: Volatility Index (VIX) has finally broken out to the upside!

Source: Short Side of Long
- Recent volatility conditions are finally starting to change. I have been watching the VIX very closely over the last few months, from a technical perspective (chart above). Even though the S&P 500 uptrend line remains intact (for now), the VIX is once again acting as a leading indicator by breaking out of its downtrend. This most likely signals that volatility is about to increase. With VIX breaking out, let us not forget the major warning signal coming out of the historically elevated Skew Index. Finally, with the recent sell off in stocks, the options market is starting to pull back from high level of call buying seen in recent weeks.
Chart 4: According to NYSE, investor leverage climbed to a new record

Source: Short Side of Long
- According to NYSE, margin debt (measure of investor leverage) climbed to yet another record high. Margin Debt now stands at $444.93 billion, climbing by over $20 billion in just one month and up almost 35% over the last 12 months. Whether we look at inflation adjusted margin debt or margin debt as a percentage of GDP, we can conclude that investor speculation has reached levels of froth where previous stock market crashes started. With record speculation relative to GDP, aged bull market without an annual decline in half a decade and historically high corporate profits, US equities remain one of the riskiest assets to invest in right now.
Bonds
Chart 5: Merrill Lynch Fund Manager Survey shows bonds still disliked

Source: Short Side of Long
- Bond sentiment surveys have now started to tick up from the extreme negative readings we have witnessed over the last few months. This is normal and to be expected as the Long Bond has now rallied four weeks in the row (pretty much the whole of January). One of the more interesting charts I would like to show you this month is the Merrill Lynch’s Survey of global fund managers and their exposure towards bonds. The chart speaks for itself.
Chart 6: After 7th consecutive monthly outflow, retail investors are back!

Source: Short Side of Long
- Recent ICI fund flows reports showed that “bond funds had estimated outflows of $247 million, compared to estimated inflows of $935 million during the previous week. Taxable bond funds saw estimated outflows of $375 million, while municipal bond funds had estimated inflows of $128 million.” With the strong sector performance in the month of January, ICI has reported that bond funds have once again started to attract inflows. It seems that the retail investor panic and follow up liquidation in May 2013, has once again marked a contrary signal for a tradable bottom, as corporate bonds reach a 6 month high.
Chart 7: Hedge funds are now going through a Long Bond short squeeze

Source: Short Side of Long
- Recent commitment of traders report (also known as dumb money) shows that small speculators have been rapidly and swiftly decreasing their net short bets on the US Treasury bond market. The latest report released on Friday showed that net short level has pulled back all the way to -22,833 contracts. In the last months report, I wrote:
In my opinion, the downtrend is extremely oversold and becoming exhausted (with various bullish divergences) so I would expect a serious short squeeze to come sooner rather than later.
Commodities
Chart 8: Commodity exposure by funds remains unchanged through Jan

Source: Short Side of Long
- Recent commitment of traders reports (also known as dumb money) showed that hedge funds and other speculators continue to remain bearish on the commodity complex, without any major change through the month of January. While exposure increased for certain commodities, it decreased for others, leaving the overall custom COT index at pretty much the same level.
Chart 9: Hedge funds have turned net short on Sugar prices again

Source: Short Side of Long
- Exposure towards agriculture also remains at one of the lowest levels in half a decade with some positive signs in the Soft complex: Cotton continues to base, Coffee has finally broken out of its downtrend and recently hedge funds have turned net short on Sugar, which has become extremely oversold (Sugar is down 13 out of the last 15 weeks, with a 53% decline over the last 3 years). I have added another portfolio position to Sugar on Thursday, which I write about and update first thing Monday.
Currencies
Chart 10: Speculator are holding net long positions on the US Dollar

Source: Short Side of Long
- Recent commitment of traders reports (also known as dumb money) showed a sharp reduction of bullish bets just this week. Cumulative positioning by hedge funds and other speculators stood at $25 billion net long last week, but has been reduced to $16.5 billion net long this week. Hedge funds continue to favour European currencies, in particular the British Pound, which has been one of the best G10 performers in the last 12 months. Negativity on the Japanese Yen is now reverting back, as the currency finally looks ready to rally due to a short squeeze. Finally, investors continue to dislike the commodity currency complex, such as the Canadian Dollar and the Australian Dollar, with large net short contracts held on both.
- Currency sentiment survey readings on the US Dollar continue to sit dead set in the centre, giving neither the bullish nor the bearish side a contrarian edge of any kind. Foreign currency sentiment is also rather mixed, with investors favouring the likes of the British Pound and shunning the Canadian Dollar. Commodity complex in general is a great barometer of a sharp sell off in the Emerging Market Currencies.
Chart 11: Hedge funds continue to increase PMs net long exposure

Source: Short Side of Long
- Recent commitment of traders reports (also known as dumb money) showed hedge funds and other speculators had a few mixed weeks when it comes to exposure in the PMs space. Aggregate positioning in both Gold and Silver has increased since the last report in January, and is now sitting at just slightly over 86,000 net long contracts. Over the last four weeks, hedge funds have up their bullish bets on Gold while decreasing their bullish bets on Silver. Disaggregated COT positioning shows a similar picture (Gold & Silver).
- Precious metals sentiment survey readings continue to remain bearish, in particular for Silver. Gold’s sentiment surveys aren’t as low as they were during early January, while Platinum has seen a full recover as investors turn more optimistic (just in time for a sell off haha). The overall picture in the PM sector remains somewhat mixed. On the positive side, Gold Miners have started outperforming Gold, which is usually a sign of an intermediate bottom in the sector. On the other hand, Silver is continuing to under perform Gold, which is usually a sign of future weakness within the sector. Which one is telling us the truth? You can be the judge.
Copyright © Short Side of Long