by Charts, Etc.
Wow, that didn't take long! Depending on the indicator or metric, the current market correction has already reached oversold levels or is fast approaching it.

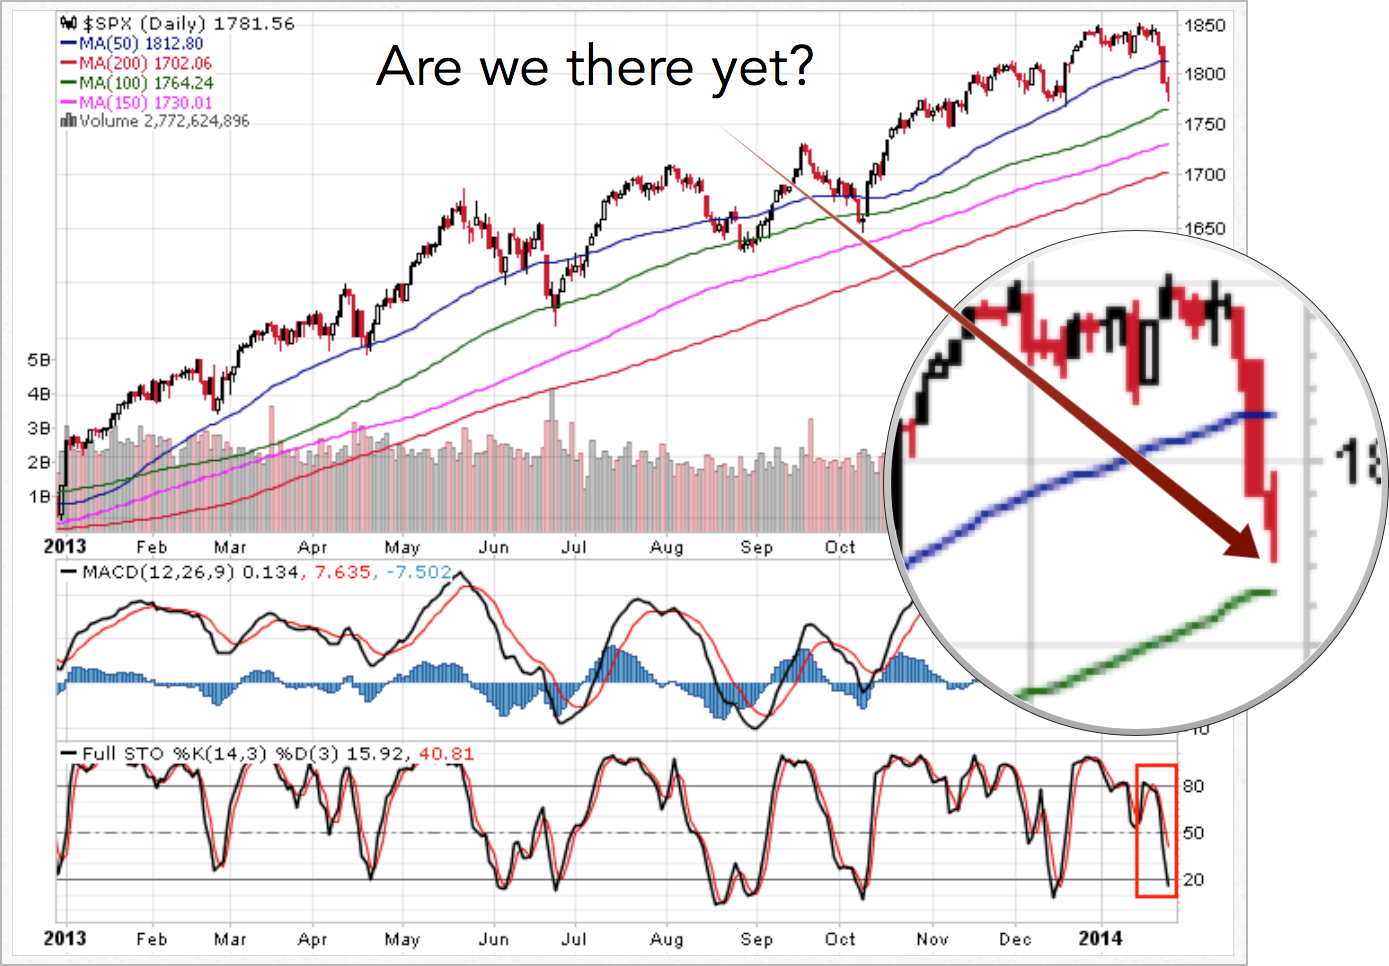
As shown in the S&P 500 chart above, the stochastic (STO, lowest inset) was at 80 last Tuesday and a week later is now below the oversold threshold of 20. That's quite a compressed and forceful sell-off. The MACD histogram at -7.5 has also attained an oversold level.
This correction or pullback is not especially surprising given the MACD continued to exhibit a bearish divergence (shown in chart above, but also mentioned numerous times on this blog), sentiment had reached optimistic extremes (see P/C ratio blog post) and I discussed how the frequent near-term abrupt reversals this month (see hourly chart) were concerning, indicating "investor confusion or indecision regarding what lies ahead in the immediate future." I would also mention that seasonally the third week in January has typically been rough for the market.
To be clear, the chart above shows the S&P 500 remains in a well-defined, secular uptrend -- a long-term bullish backdrop. The 50-day moving average has been breached, but this has occurred more than a few times within this ongoing uptrend, and the 100-day moving average has served as capable support, now residing at 1764.
So the question is: are we oversold enough, i.e. are we at a bottom yet? I would argue not yet. Referencing the chart above, both the MACD histogram and stochastic have reached oversold levels, however we want to see them turn up and give crossover Buy signals to better confirm the arrival of a meaningful bottom.
As for other indicators, the 10-day TRIN got close to 1.40, a level which has signified intermediate to longer-term lows in the past:

Although for most of last year, the 10-day TRIN reaching the 1.20-1.30 range was often enough to establish a bottom.
The 10-day NYSE advance-decline volume indicator has not (yet) reached the -200 threshold that typically denotes a meaningful low:

But again, last year the -100 level was often enough to satisfy a bottom.
The 5-day equity put-call ratio has spiked higher but remains very low, inferring still too much optimism exists:

And the 4-week NYSE advance-decline line got below zero, but has not reached the -500 level, much less -250:

In short, it appears selling pressure since early last week has been severe, with the market rapidly approaching an oversold condition, but based on past precedence has not yet reached washed-out levels.
(Source for all charts: Stockcharts.com)
Copyright © Charts, Etc.