In this week's edition of the SIA Equity Leaders Weekly, we are going to revisit a recent post we did on the Bullish development on the relationship between the U.S. Dollar and the Canadian Dollar through the USDCAD. In addition, we will look at how the strength in the U.S. Dollar has impacted the strength of U.S. Equities over CAD Equities and what this continues to mean going forward.
United States Dollar/Canadian Dollar (USDCAD)
The USD continues to show strength vs the CAD and this week we saw the USD reach the 1.1182 level which it hasn't seen since late 2009. After breaking through key resistance at the 1.0639-1.0745 level, we mentioned the importance of this breakout as it signaled a significant trend change between the USDCAD relationship that saw CAD dominate USD for over 10 years going back to 2003. Except for a brief period in 2008-2009 during the global financial crisis where there was a flight to liquidity and therefore the USD, this relationship favoured the CAD during this entire time period. However, as we have mentioned several times before, this recent break of the 10 year downtrend line leaves plenty of room for the USD to move higher against the CAD as the next potential resistance level is at 1.1521. To the downside, support is now found at 1.0639 and again at 1.0124.
This continued strength in the USD vs the CAD will continue to have important implications for both the Commodities markets and by extension the CAD Equity market which is so heavily resource based. This change should not be ignored by equity investors as strength in the USD adds to the continued relative outperformance of U.S. Equities over Canadian Equities.
Click on Image to Enlarge

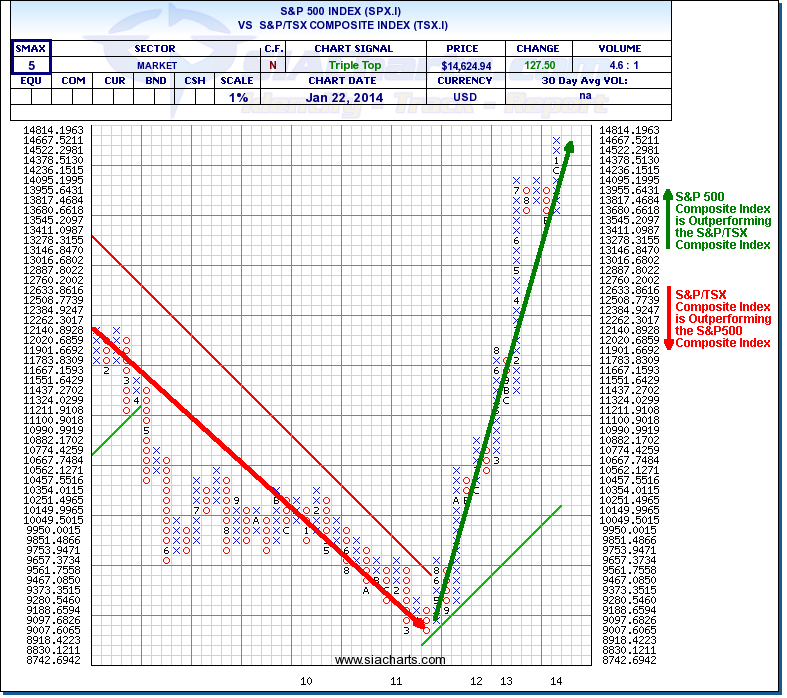
S&P500 Composite Index vs S&P/TSX Composite Index (SPX.I vs TSX.I)
This chart shows the continued outperformance we have seen from the S&P500 Composite Index over the S&P/TSX Composite Index with the green arrow showing relative outperformance since October 2011. This strength in U.S. Equities vs CAD Equities coincided with the strength in the USD vs CAD and also the weakness in Commodities including Gold.
As the USD started to strengthen vs the CAD in late 2011, this became a tailwind to the U.S. Equity market which broke through a key resistance level on October 2011. This key resistance level was the SPX.I/TSX.I 10 year downtrend line which began in 2003. Except for a brief period in 2008-2009 during the global financial crisis where there was a flight to the most liquid equity market in the world, ie. U.S. Equity market, the CAD Equity market dominated the U.S. Equity market during that entire time period. However, the break of the 10 year downtrend line over 2 years ago signaled a significant trend change between the U.S. Equity market and the CAD Equity market.
Our subscribers have benefited significantly from our Asset Allocation Model over the past 2 years as they saw U.S. Equities move into the #1 spot back in January 2012 and stay there for virtually the entire 2 year period. Conversely, they would also have seen CAD Equities rank much lower than U.S. Equities over this time period and Commodities occupy the #7 spot for virtually the entire 2 year period as well. This still presents an opportunity for those investors who have not increased their exposure to the U.S. Equity market.
Click on Image to Enlarge

SIACharts.com specifically represents that it does not give investment advice or advocate the purchase or sale of any security or investment. None of the information contained in this website or document constitutes an offer to sell or the solicitation of an offer to buy any security or other investment or an offer to provide investment services of any kind. Neither SIACharts.com (FundCharts Inc.) nor its third party content providers shall be liable for any errors, inaccuracies or delays in content, or for any actions taken in reliance thereon.
Copyright © SIACharts.com