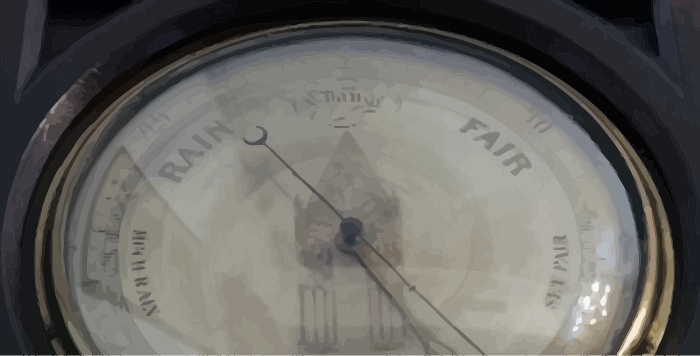
Lacking the requisite initials after our name, we are on occasion confined to spending some quality time looking and thinking about the markets from perspectives that some of our more "qualified" - yet quantitatively driven brethren might consider mere spurious observations. Then again, in our experience with markets, plain logic - with respect to form and proportion within the historical narrative, is often overlooked for the sake of complexity and the relative comfort of probabilities. Monetary policy, interest rates, currency differentials: when it comes to the markets and the trillions of dollars that fill their vast reservoirs, there is an endless numeric capacity to robustly build ones own respective framework and model, that inevitably can engender a certain bias.
"There are no facts - only interpretation" - Nietzsche
In the first half of 2011 we held a contrarian opinion that interest rates would continue lower and break the previous cycle lows - despite a frothy commodity-scape that was misleading many participants to hitch themselves to an inflationary driven train.
________________________________________________________________

"It is hard to deny that there is at the very least asymmetry in the above chart with regards to each respective rate cycle (trough to new lows). The present cycle (approximately 70 years) is actually following the greatest degree of symmetry - likely because of the historic spike in interest rates in the early 1980's drawing out the trend. In both the previous cycles shown (~ 60 and 55 years, respectively), the final leg down is swift. However, once the previous cycle low was broken, rates tended to base for an extended period of time." Man Versus Nature - June 1, 2011
________________________________________________________________
Whatever inflation had made its way into the system by Q2 2011, participants future expectations had been disproportionally influenced and modeled by the relative performance of recent trends. While a certain recency bias was building another great wall-of-worry against the collective sentiment of equity market participants, the same narrative was also filling the sails of the bond market bears and numerous portfolio theses predicated on rising rates and inflation. Adding to the uncertainty, was a Fed that continued to work in the realm of policy - literally defined by a certain esoteric calculus. The irony being, quantitative easing primarily became a behavioral reflex for the markets to consider - despite the enormity of quantity.The fact - or rather - interpretation stands:
For all of its purported dislocative potential, the Fed's historic monetary policies did very little to deviate yields from what has been a genuinely balanced and reflexive trajectory lower from the profound 1981 highs.

From strictly a structural perspective, yields had been following a declining trend line for several hundred years. The chart below only depicts the past ~ 140 years. Considering the market is running out of road on the downside and the relative symmetry of the broader interest rate cycle over the past 70 years, the mirrored trajectory would imply that rates would remain in a range for some time. As the charts depicts - and similar to asset cycle tops, yields trough over a much longer timeframe. In light of the mirrored move trajectory, extended - even by Fedspeak definition, may be a relative phrase.

As we had hoped, yields appear to have completed a retest of their September highs and are poised to retrace a significant measure of the move that began last May. Although the December jobs report was weaker than expected - and likely provided the breaking catalyst for yields; we don't believe the Fed will need to alter the nature of the taper. Broadly speaking, at this point we would be looking for a long-term range to establish itself, as depicted below with yields historically stretched to the upside - arguably to an even larger degree then they had in 2012 at the lows. Comparatively speaking, the range between 3.0 and 1.5 percent covers considerable territory.

With the recent golden bear still growling in the markets near-view mirror, an almost daily commentary is now debated by participants and pundits about what drives and ails the gold market. Is it fear, inflation, interest rates, the US dollar - China? As much as we could say yes to all of the above in various market climates, since last March the precious metals and commodity currency sectors have exhibited a strengthening negative correlation with yields. While the precious metals bear began with a major dollar low in Q2 2011, the divergences in inflation expectations and yields since last March (e.g. rise in real rates) finished off the correction.What we expect to encounter this year and to which we spoke of in recent notes (see Here & Here) - is the unusual market environment where rates revert from an extreme, while another pulse of inflation moves higher through a broadening range.
From a historical perspective since coming off the gold standard in 1971 - we would argue that gold relative to yields is the most over-extended from a momentum perspective as it has ever been. On the four previous occasions with similar set-ups - a major tradable low was established. 
Parting thoughts:
Playing devils advocate to our leading sentiments, we wonder do rates continue to follow the mirror of the cycle - or does the potential energy sitting on the Fed's balance sheet eventually get met by demand and pull forward the next? Is the skew between core PCE and yields (shown below) indicating as much? We would speculate that the performance of silver and gold and the nature of that ratio would give some clues as to what lies ahead.Historically speaking, gold and silver have in the past always exhibited classic technical V shaped lows. The current structure - a W - indicating a retest of support, is very atypical. That being said, in relation to the yield and interest rate cycle since 1970, gold has never traded in this climate. Just as gold exhausted in the early 1980's in similar fashion to interest rates (quick volatile reversal), we expect the troughing yield environment described before to put a floor under precious metals and push gold higher through the range.Welcome to Esoterica.

Copyright © Market Anthropology