In this weeks edition of the SIA Equity Leaders Weekly, we are going to relook at a Bullish development on the relationship between the U.S. Dollar and the Canadian Dollar through the USDCAD. In addition, we will take a look at Natural Gas as it has been one Commodity showing some short-term strength.
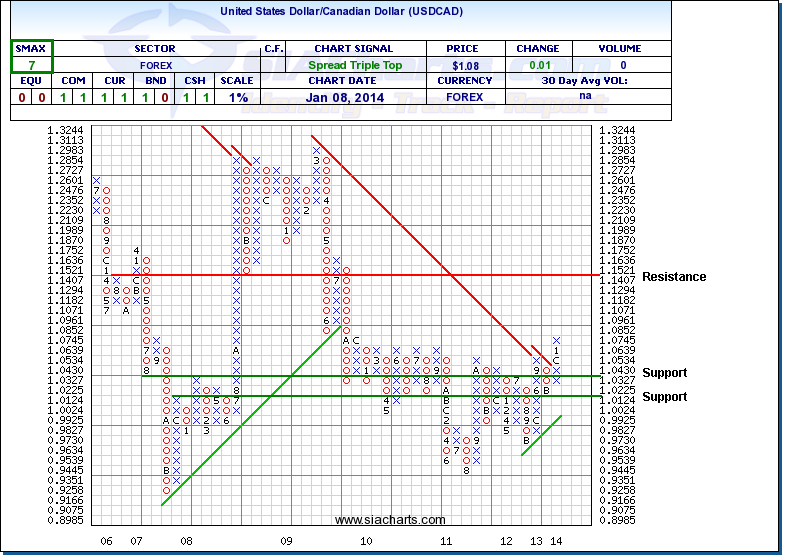
United States Dollar/Canadian Dollar (USDCAD)
Last year, the Canadian dollar lost almost 7% of its value against the U.S. dollar. The reversal of fortune by the USD has not come at an amazingly fast pace but over the past couple of years has consistently moved upward vs. its Canadian counterpart. The CAD dollar has now dropped below 93 cents for the first time since the end of 2009. Not surprisingly, this change cannot be ignored by equity investors as strength in the USD adds to the continued relative outperformance of U.S. Equities over Canadian Equities.
Looking at the USDCAD today, we can see that it has moved above a key resistance we have highlighted before at the 1.0639-1.0745 level. We can see the next resistance level and price objective is significantly higher in the 1.15 range giving the USD some potential room to move to the upside. To the downside, support has now moved up to 1.0327 and to 1.0124 should this trend reverse. For those investing in U.S. Equities over Canadian Equities, this relationship continues to add relevance to your portfolio allocation or could give you some opportunity within your required cash holdings in your portfolios.
Click on Image to Enlarge
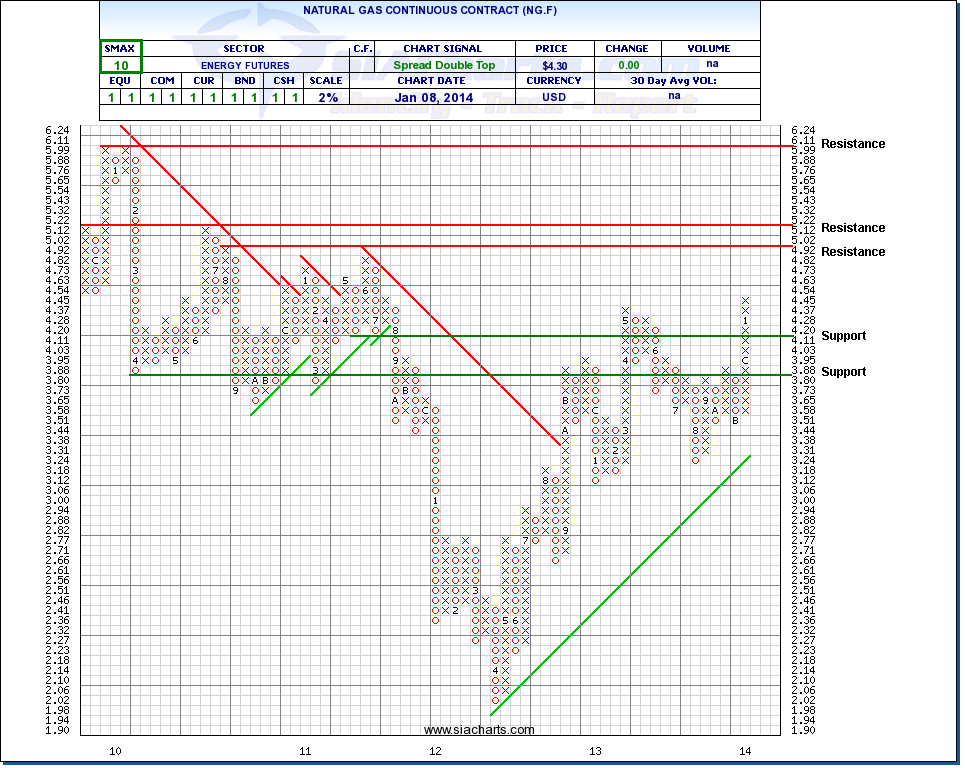
Natural Gas Continuous Contract (NG.F)
Since we last looked at Natural Gas, NG.F has seen a reversal to the upside moving through some key resistance levels to new 2-year highs. The next resistance level should Natural Gas continue its upward trend is found at $5.02 with further resistance quickly above at $5.22. To the downside, support is found at $4.11 and at $3.80.
With the SMAX score now a 10 out of 10, NG.F is showing near-term strength against the other asset classes, but as commodities overall still rank as the lowest asset class from a long-term perspective, there is still caution towards the long-term strength of this investment. For more information on the long-term strength of Natural Gas versus other Commodities, feel free to refer to the SIA U.S. Commodities ETF Report and the SIA CAD Commodities ETF Report, or you can use other SIA ETF Reports that compare Natural Gas versus other opportunities.
Click on Image to Enlarge
SIACharts.com specifically represents that it does not give investment advice or advocate the purchase or sale of any security or investment. None of the information contained in this website or document constitutes an offer to sell or the solicitation of an offer to buy any security or other investment or an offer to provide investment services of any kind. Neither SIACharts.com (FundCharts Inc.) nor its third party content providers shall be liable for any errors, inaccuracies or delays in content, or for any actions taken in reliance thereon.
Copyright © SIACharts.com