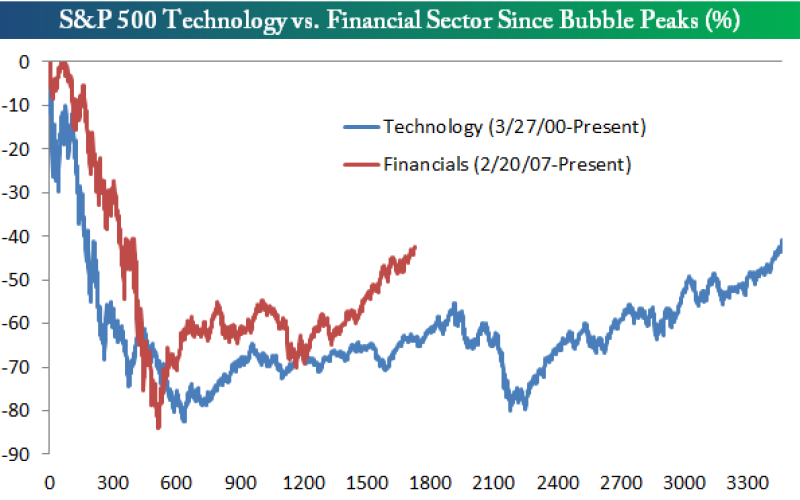
One of the things we've been tracking here at Bespoke over the past few years is the post-crash pattern of the Technology and Financial sectors. The bursting of the Tech bubble came after its peak in March 2000, while the peak for the Financial sector came in February 2007 prior to the Financial Crisis.
Below is a chart showing the percentage change from the respective peaks of the Tech (3/27/2000) and Financial (2/20/2007) sectors. As you can see in the chart, both sectors experienced crashes of more than 80% over very similar time frames. Once they hit bottom, they each began a long road to recovery.
The "post-bubble burst" patterns of the two have begun to diverge quite a bit this year, however. As shown, the Financial sector has recovered much more than the Tech sector had at this point following its crash. Right now, the Tech sector is 5,026 days removed from its prior peak, while the Financial sector is 2,505 days removed from its peak. But while it has been twice as long since the peak for Tech, both sectors have now recovered nearly the exact same amount and are roughly 42% below their prior highs.
Copyright © Bespoke Investment Group