For this week's SIA Equity Leaders Weekly, we will continue with Part 2 of our series from last week showing the power of Relative Strength vs traditional Technical Analysis and why it is important to have an objective overlay within your investment process. We will look at Blackberry's stock price over the past 4 years to illustrate this point.
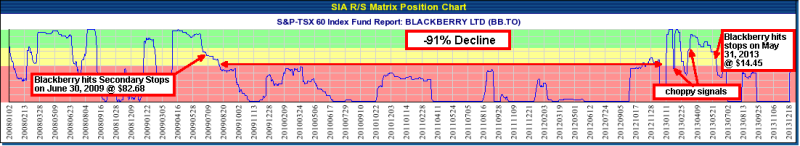
Blackberry (BB.TO) Position Matrix
Looking at Blackberry's Matrix Position Chart, we can see it hit our stops on June 30, 2009 at a price of $82.68. For the next 3.5 years, it remained in our Unfavoured Zone despite numerous reports and analysis by many in the industry suggesting this was simply a short term correction and Blackberry still looked strong going forward. This was a -91% drop for those who held this stock during this period. The challenge for many investors when a stock drops this significantly is to have the conviction to "cut your losses short". However, how does an investor create the conviction to do this consistently when utilizing "subjective" indicators? Relative Strength empowers the investor with an "objective" tool to assess the strength of any investment vs its peer group at any given time. This allows the investor to avoid the "value traps" of buying a stock just because it is low, or selling too early in a stock's uptrend just because it is high.
Click on Image to Enlarge

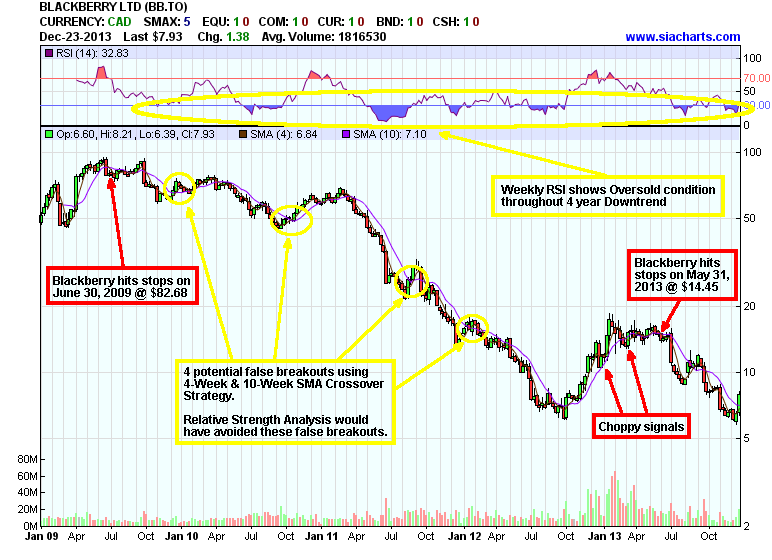
Blackberry (BB.TO) Chart
Now let's overlay some traditional technical analysis indicators on Blackberry to see the results. First, looking at the RSI it is no surprise that it looks very Oversold throughout much of the 4 year strong downtrend and the temptation would have been to buy back in as the stock dropped significantly. Many investors thought it was a "screaming value buy" as it dropped 50% +. Second, let's examine a popular trading strategy among technicians called the "Moving Average Crossover Strategy." We are using the 4-Week SMA and 10-Week SMA for this example and when the shorter MA crosses below the longer MA it is a "sell signal" and when it crosses above it, it is a "buy signal." Using this strategy, an investor would have experienced 4 potential false breakouts during this 4-year downtrend. The phrase "trying to catch a falling knife" perfectly describes the painful experience of many investors who were trying to trade Blackberry at this time. Finally, if an investor was to combine both the RSI readings and the MA Crossover Strategy, it is highly likely they would have been in and out of this stock very frequently throughout this time period, and most likely would have caught most of its downtrend! In conclusion, the Relative Strength approach provided an objective perspective on the weakness of Blackberry's stock during this -91% decline and would have allowed an investor to "cut their losses short!"
For a more in-depth analysis on this example, view the video by clicking here:
https://www.siacharts.com/relative_strength_analysis_apple_blackberry.wmv (use Internet Explorer browser to view video)
Click on Image to Enlarge
SIACharts.com specifically represents that it does not give investment advice or advocate the purchase or sale of any security or investment. None of the information contained in this website or document constitutes an offer to sell or the solicitation of an offer to buy any security or other investment or an offer to provide investment services of any kind. Neither SIACharts.com (FundCharts Inc.) nor its third party content providers shall be liable for any errors, inaccuracies or delays in content, or for any actions taken in reliance thereon.