For this week's SIA Equity Leaders Weekly, we are going to show the power of Relative Strength in terms of how it can vastly differ from traditional Technical Analysis signals and why it is important to have an objective overlay within your investment process. We will look at Apple's stock price over the past 4 years to illustrate this point.
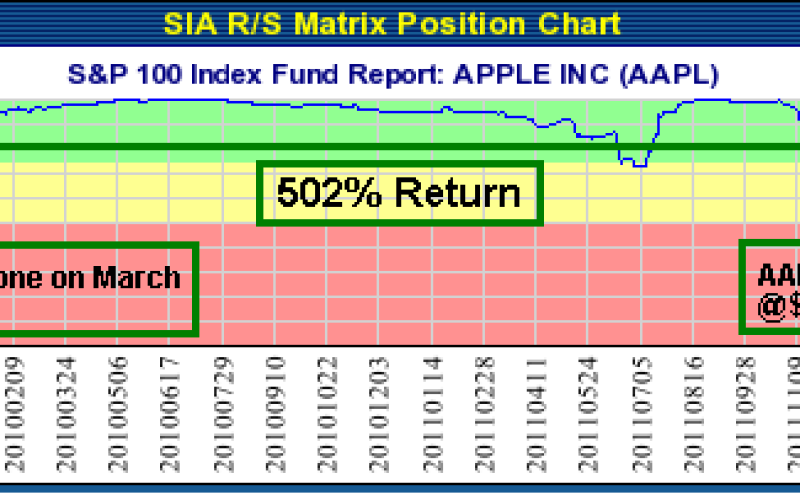
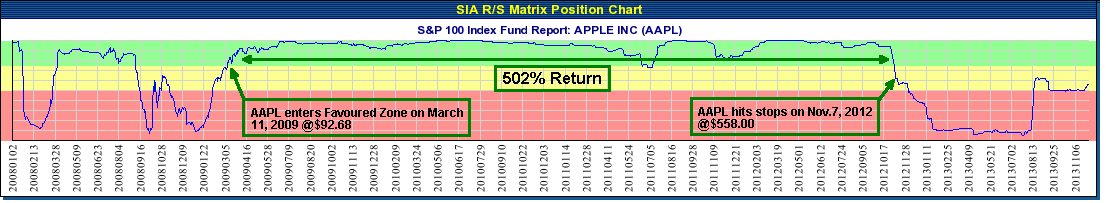
Apple (AAPL) Position Matrix
Looking at Apple's Matrix Position Chart, we can see when it moved into the Favoured Zone of the SIA S&P 100 Report, back in March 2009 at a price of $92.68. For the next 4 years, it remained a "Hold" until Nov. 2012 when it hit our secondary stops at a price of $558.00. This was over a 500% return for those who followed our Relative Strength signals over that time period. You have heard the old adage, "in order to be successful at investing you need to let your winners ride and cut your losses short!" Sounds nice in theory but the challenge is how do you implement this in practice? How do you define "how high, high is" and "how low, low is?" Relative Strength enables you to objectively define these parameters because as long as any investment is showing strength vs. its peer group, it isn't too high that it needs to be sold and as long as any investment is showing weakness vs. its peer group, it isn't too low that it needs to be bought!
Click on Image to Enlarge
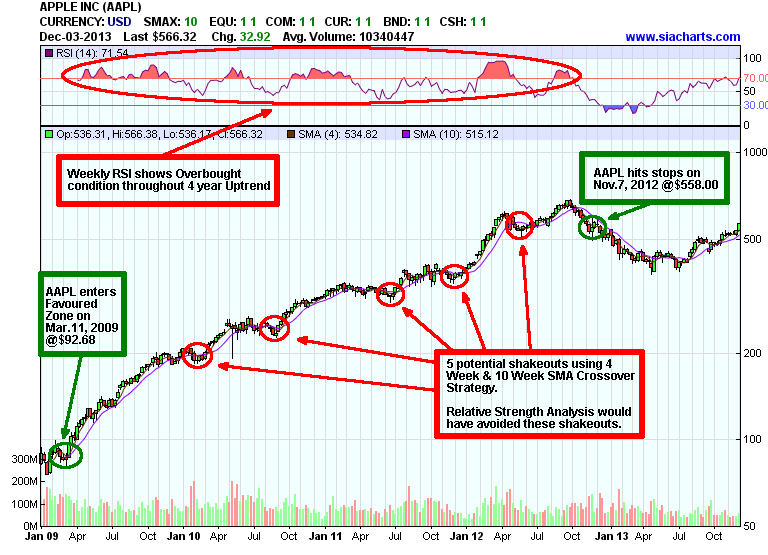
Apple (AAPL) Chart
Now let's overlay some traditional technical analysis indicators on Apple to see the results. First, looking at the RSI it is no surprise that it looks very Overbought throughout much of the 4 year strong uptrend and the temptation would have been to sell and take the profits. Second, let's examine a popular trading strategy among technicians called the "Moving Average Crossover Strategy." We are using the 4-Week SMA and 10-Week SMA for this example and when the shorter MA crosses below the longer MA it is a "sell signal" and when it crosses above it, it is a "buy signal." Using this strategy, an investor would have experienced 5 potential shakeouts during this 4-year uptrend. This would have reduced your returns on Apple vs. our Relative Strength signals. Finally, if an investor was to combine both the RSI readings and the MA Crossover Strategy, it is highly likely they would have been in and out of this stock very frequently throughout this time period, reducing their overall results! Therefore, the Relative Strength approach provided an objective perspective on the strength of Apple stock during this 500% uptrend and would have allowed an investor to "let their winners ride!"
For a more in-depth analysis on this example, view the video by clicking here:
https://www.siacharts.com/relative_strength_analysis_apple_blackberry.wmv (use Internet Explorer browser to view video)
Next week, we will show the same comparison using Blackberry's stock price over the same time period. Stay tuned!
Click on Image to Enlarge
SIACharts.com specifically represents that it does not give investment advice or advocate the purchase or sale of any security or investment. None of the information contained in this website or document constitutes an offer to sell or the solicitation of an offer to buy any security or other investment or an offer to provide investment services of any kind. Neither SIACharts.com (FundCharts Inc.) nor its third party content providers shall be liable for any errors, inaccuracies or delays in content, or for any actions taken in reliance thereon.