Three weeks ago, we discussed the key psychological resistance levels that were coming up for both the S&P 500 Index and the Nasdaq Composite Index. For this weeks SIA Equity Leaders Weekly, we are going to revisit both of these indices to see where they both now stand.
S&P 500 Index (SPX.I)
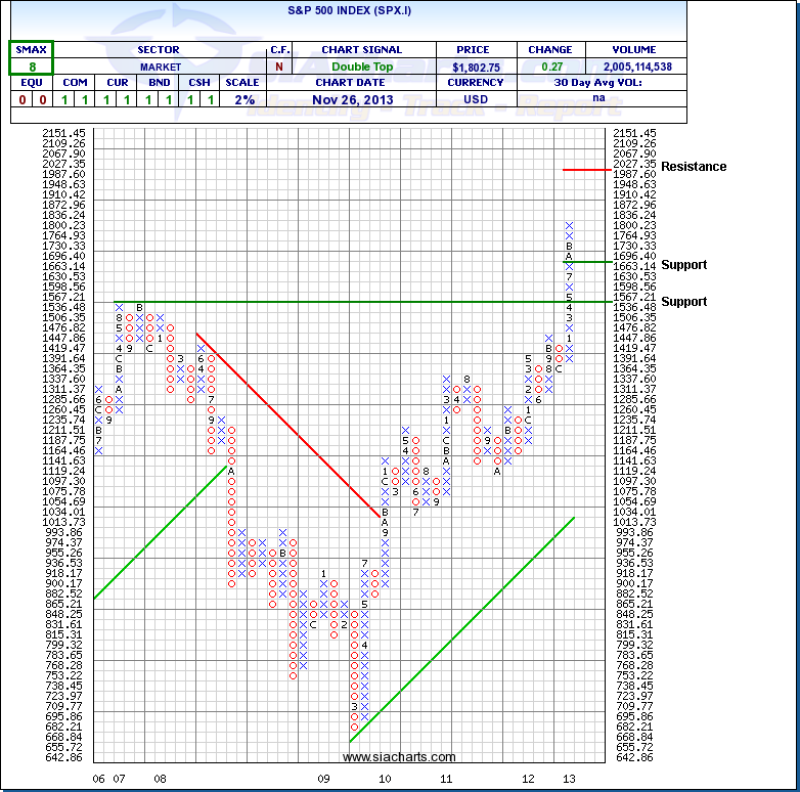
The key resistance level that we were looking at for the S&P 500 Index was the 1800 level. Looking at the chart to the right, we can see that we have now broken through that 1800 level, moving the next resistance level all the way up to the 2000 level. This gives the SPX.I plenty of potential room to move before its next major resistance, although it is likely that we will see some resistance again around 1900.
Support is now at 1663.14 and again below that 1536.48. The S&P 500 index has risen for six weeks straight and is up over 26% so far this year. The S&P 500 has closed above major round-number milestones three times this year: 1,500 on January 25th, 1,600 on May 3rd, and 1,700 on August 1st.

Click on Image to Enlarge
Nasdaq Composite Index (NASD.I)
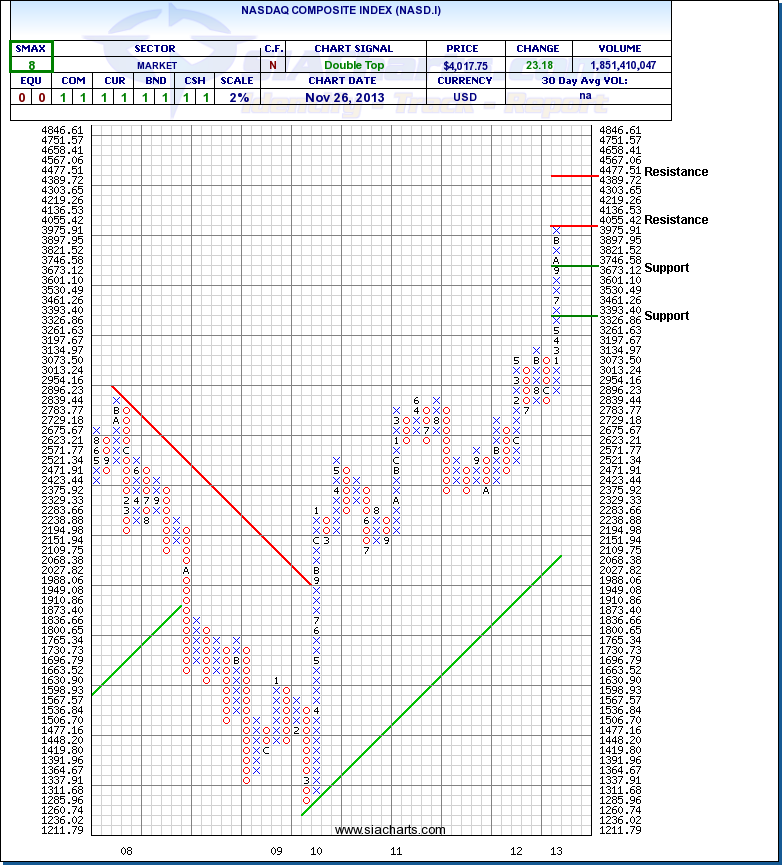
The 4000 level was the key resistance for the NASD.I with the index gapping above that level and immediately dropping back down below it on Monday, before finally closing above 4000 on Tuesday. Even with the close above 4000, looking at the chart of the NASD.I, we can see that the actual resistance level is at 4055.42 so the Index is right under resistance at this point. Should the strength continue on, then the next resistance is up at 4477.51, allowing plenty of potential upside before that could come in to play. Support has now moved to 3673.12 and again at 3326.86.
With both of these indices breaking through their resistance levels, it will be interesting to watch to see if we can move on to new highs, to the point that these resistance levels turn in to support under the polarity principle (what was formerly resistance can turn into support or formerly support can turn into resistance).
** One thing to also mention is that the Dow Jones Industrial Average has also moved above a key resistance level at 16000.
Click on Image to Enlarge
SIACharts.com specifically represents that it does not give investment advice or advocate the purchase or sale of any security or investment. None of the information contained in this website or document constitutes an offer to sell or the solicitation of an offer to buy any security or other investment or an offer to provide investment services of any kind. Neither SIACharts.com (FundCharts Inc.) nor its third party content providers shall be liable for any errors, inaccuracies or delays in content, or for any actions taken in reliance thereon.