

In this week's edition of the SIA Equity Leaders Weekly, we are going to revisit two key Commodities: Copper and Crude Oil. Both of these Commodities have shown weakness along with Gold and Natural Gas charts we looked at last week, adding pressure to those equities that benefit or prosper from their pricing. This weakness highlights the importance of the SIA Asset Class rankings which has seen Commodities at the bottom for multiple years. For those wondering if there may be a bottom in Commodities coming these updated charts can shed some light on the risk vs. reward of that view.
Copper Continuous Contract (HG.F)
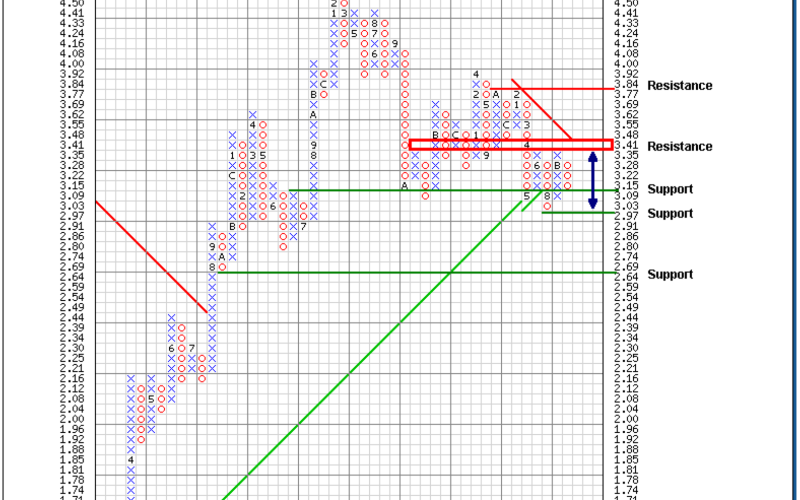
We last looked at the Copper Continuous Contract (HG.F) at the end of August highlighting the trading channel it has moved sideways in this fall and the tightening of the long-term trend lines. The resistance level at $3.41 held and has now pulled back to weak support at $3.09. Further support to the downside is found at $2.97, the low from August of this year, and at $2.64 if the weakness continues.
The downwards trend line is providing more resistance in the $3.41-$3.48 range to the upside that would have to be taken out as confirmation for a potential reversal. Further resistance is found at the high from 2013 at $3.84. With a short-term SMAX score of 5 out of 10, Copper is showing some weakness against other classes that may continue to lead to the indifference we may continue to see. With the overall weakness in Commodities, moving sideways in a positive equity market could result in continued relative weakness and opportunity cost of not holding less risky asset classes.
Click on Image to Enlarge
Crude Oil Continuous Contract (CL.F)
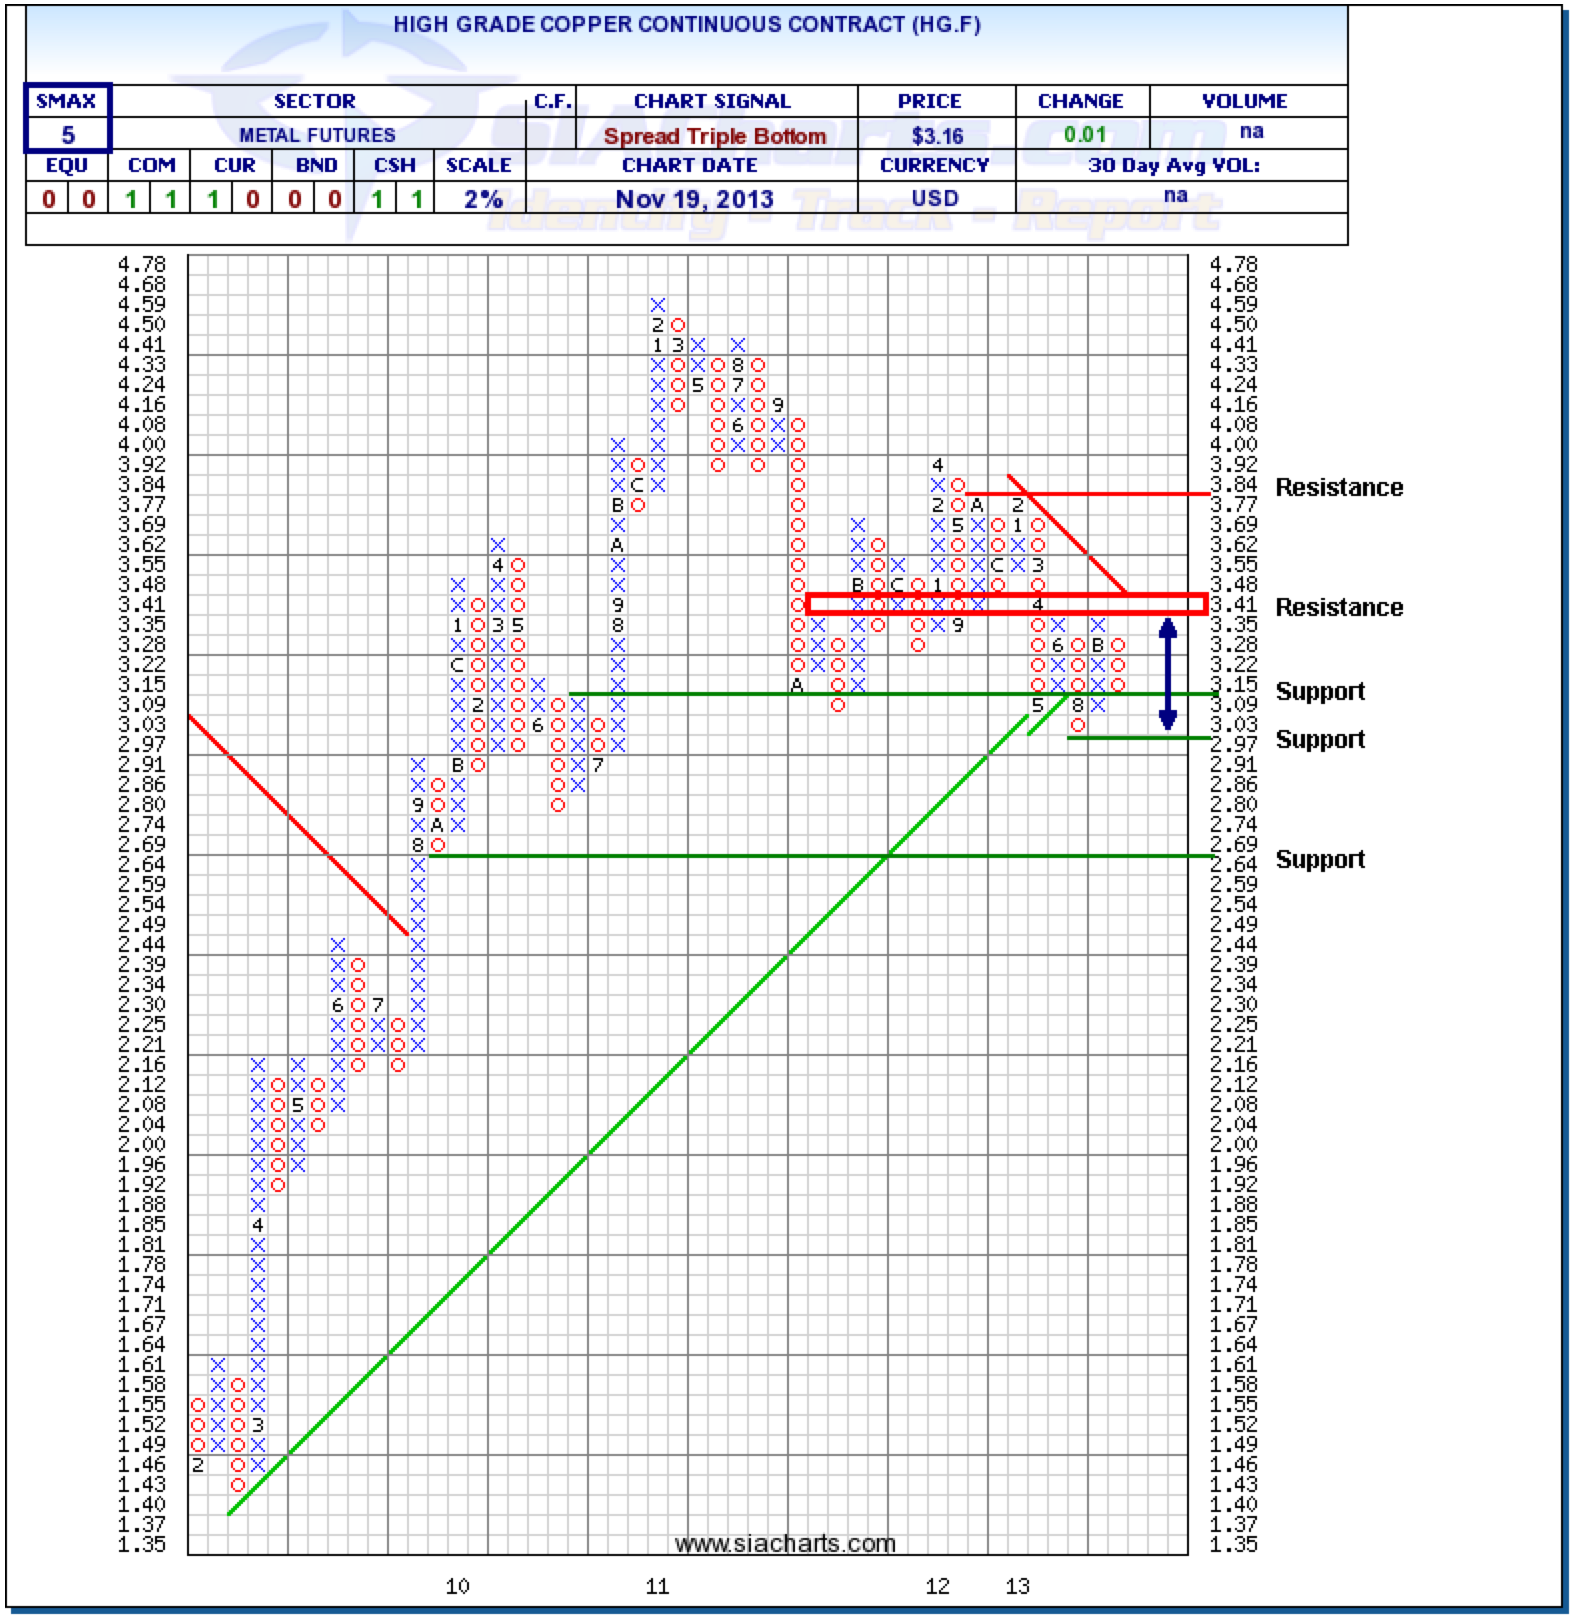
Crude Oil has continued to move down in its sizable pullback over the past two months. CL.F is now approaching a key support level at $90.31 that is also supported by the upwards trend line. A move through this level could see further support at $83.43 come into play. If this support level does hold in the near-term, the first resistance level will be up near $100 at $101.70 with further resistance at the high of 2013 at $112.28.
With the SMAX at a score of 4 out of 10, Crude Oil has weakened slightly for its near-term outlook against other asset classes. Both these Commodities may be at critical junctures with their continued relative weakness and it will be interesting to see how much further the TSX can go without some of the major Commodities contributing for an extended rally.
Click on Image to Enlarge
SIACharts.com specifically represents that it does not give investment advice or advocate the purchase or sale of any security or investment. None of the information contained in this website or document constitutes an offer to sell or the solicitation of an offer to buy any security or other investment or an offer to provide investment services of any kind. Neither SIACharts.com (FundCharts Inc.) nor its third party content providers shall be liable for any errors, inaccuracies or delays in content, or for any actions taken in reliance thereon.